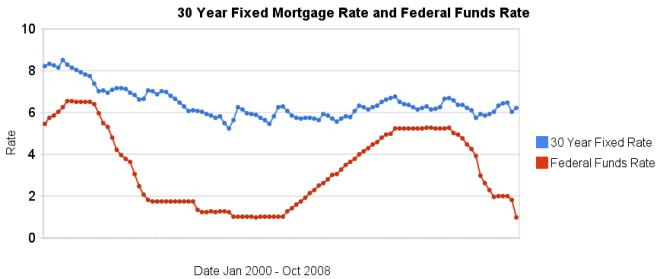
More dramatic evidence that changing in the federal funds rate do not lead to similar changes in 30 year fixed mortgage rates. It is true the last few months are very unusual times for the credit market. However, the current lack of correlation is not the exception, the graph clearly shows there is very little correlation between changes in the two interest rates.
Related: historical comparison of 30 year fixed mortgage rates and the federal funds rate – Affect of Fed Funds Rates Changes on Mortgage Rates – posts on financial literacy – Jumbo v. Regular Fixed Mortgage Rates: by Credit Score
For more data, see graphs of the federal funds rate versus mortgage rates for 1980-1999. Source data: federal funds rates – 30 year mortgage rates
Leave a Reply