Author: John Hunter

  • Avoiding Withdrawing Retirement Savings Starts Early

    In the USA we fail to save nearly enough for retirement by and large. And fail to save emergency funds or prepare for economically difficult times. We by and large chose to spend today and hope tomorrow will be good rather than first establishing a good financial safety net before expanding spending.

    When people are debating withdrawing from their retirement account it is actually not the important decision it seems to be (normally). Normally the important decision was years before when they chose to take on consumer debt and not to build up an emergency fund. And when they failed to just build up saving beyond that which could be used for nice vacations, a new car, or to live on in economically challenging times.

    If someone had been saving 15% of their salary in retirement since they started working if they took an amount that left them at 10% that is hardly a horrible result. While someone that was already behind by say adding just 3% to retirement savings and they took out all of it that would be much worse.

    And we should remember even having a retirement account to withdraw from might put you ahead of nearly 50% of the population (and our state and federal governments, by the way). If you have to resort to withdrawing from your retirement account don’t think of that as the failure. The failure was most likely the lack of savings for years prior to that. And as soon as possible, re-fund your retirement account and build up a strong emergency fund, even if that means passing spending on things you want.

    Related: Retirement Savings Allocation for 2010401(k)s are a Great Way to Save for RetirementSave Some of Each Raise

  • USA Economy Adds 151,000 Jobs in October and Revisions Add 110,000 More

    Nonfarm payroll employment increased by 151,000 in October, and the unemployment rate was unchanged at 9.6%, the U.S. Bureau of Labor Statistics reported today. Since December 2009, nonfarm payroll employment has risen by 874,000.

    The BLS also increased previous estimates by 110,000 jobs in adjustments to August and September. The change in total nonfarm payroll employment for August was revised from -57,000 to -1,000, and the change for September was revised from -95,000 to -41,000.

    Adding 151,000 jobs last month (especially with a revision that adds 110,000to our previous estimates) is good news but not great news. We really need to be adding at least 250,000 and hopefully 400,000 for many months in a row. Both to keep up with population growth and restore some of the 8 million job losses from the credit crisis recession. The fears of a depression that some had a few years ago though are decreasing as we provide slow but real growth. However those gains are far from certain to continue, but overall things look much better than than did 2 years ago.

    In November of 2008 the economy lost over 500,000 Jobs and in October 2009 the unemployment Rate Reached 10.2%.

    The number of unemployed persons, at 14.8 million, was little changed in October. Among the major worker groups, the unemployment rate for adult men (9.7%), adult women (8.1%), teenagers (27.1%). The number of long-term unemployed (those jobless for 27 weeks and over) was about unchanged over the month at 6.2 million.

    Both the civilian labor force participation rate, at 64.5 percent, and the employment-population ratio, at 58.3 percent, edged down over the month.

    About 2.6 million persons were marginally attached to the labor force in October, up from 2.4 million a year earlier. (The data are not seasonally adjusted.) These individuals were not in the labor force, wanted and were available for work, and had looked for a job sometime in the prior 12 months. They were not counted as unemployed because they had not searched for work in the 4 weeks preceding the survey.
    (more…)

  • Google Finance Portfolio Charting

    investment portfolio charting from Google Finance
    Google finance has a nice new feature to let you chart your entire portfolio. You can then compare it to the S&P 500 or other stocks. This is a very nice feature. Yahoo Finance is about the only part of Yahoo I still use. I do use Google Finance some but they still fall short and I use Yahoo Finance much more. This feature will at least encourage me to put my portfolio in Google and start tracking it.

    It would be great if this could give you portfolio annual rates of return (including factoring in cash additions and withdraws and keeping track of sales over time to show a true view of the portfolio). It does look like it will factor in stock purchases and sales which is very nice. You can import csv files with transaction history – another nice feature.

    It also strikes me as a very smart move (as a Google stockholder that is nice to see) as advertising rates around investing are high. The more time Google can provide financial advertisers the more income they can make.

    Related: Lazy Portfolios Seven-year Winning StreakGoogle Posts Good Earning But Not Good Enough for Many (April 2010)Dollar Cost AveragingCurious Cat Investing Books

  • Bond Yields Stay Very Low, Treasury Yields Drop Even More

    chart showing corporate and government bond yields 2005-2010
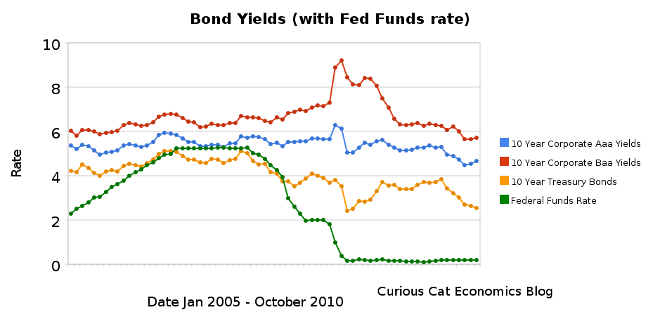
Chart showing corporate and government bond yields from 2005-2010 by Curious Cat Investing Economics Blog, Creative Commons Attribution, data from the Federal Reserve.

    Bond yields have dropped even lower over the last 6 months, dramatically so for treasury bonds. 10 year Aaa corporate bonds yields have decreased 61 basis points to 4.68%. 10 year Baa yields have decreased 53 basis points to 5.72%. 10 year USA treasury bonds have decreased an amazing 169 basis points to a incredibly low yield of %2.54. The federal funds rate remains under .25%.

    The Fed continues to try and discourage saving and encourage spending by punishing savers with policies to drive interest rates far below what the market alone would set. Partially this is a continuation of their subsidy to the large banks that caused the credit crisis. And partially it is an attempt to find a way to encourage spending to try and build job creation in the economy. The Fed announced they are taking huge steps to purchase $600 billion more bonds in an attempt to lower rates even further (much of the impact has been priced into the market as they have been saying they will take this action – but the size is larger than the consensus expectation). I do not think this is a sensible move.

    Savers do not have many good options for safely investing retirement assets for a reasonable income. The best options are probably to hold short term bonds and money markets and hope that the Fed finally stops making things so difficult for them. But that will take awhile. I think investing in medium or long term bonds (over 4 years) is crazy at these rates (especially government bonds – unless you are a large bank that can get essentially free money from the Fed to then loan the government and make a profit). Dividends stocks may be a good alternative for some more yield (but this needs to be done carefully to not take unwise risks). And I think you to look at investing overseas because these fiscal policies are just too damaging to savers to continue to just wait for a decent rate of return in bonds in the USA. But there are not many good options. TIPS, inflation protected bonds, are another option to consider (mainly as a less bad, of bad choices).

    It is a great time to take on debt however (as often is the case, there are benefits and costs to economic conditions). If you have a mortgage, and can qualify, or are looking to buy a home, mortgage rates are amazingly low.

    Related: Bond Rates Remain Low, Little Change in Last 6 Months (April 2010)Bond Yields Change Little Over Previous Months (December 2009)Chart Shows Wild Swings in Bond Yields in Late 2008Government Debt as Percentage of GDP 1990-2009 in USA, Japan, Germany, China…

  • 3rd Quarter USA GDP Up 3% from 2009

    Real gross domestic product increased at an annual rate of 2.0% in the third quarter, reaching a annual rate of $14,730 billion (that is, from the second quarter to the third quarter), according to the “advance” estimate released by the Bureau of Economic Analysis. In the second quarter, real GDP increased 1.7%. The 3rd quarter real USA GDP was up 3.1% compared to the 3rd quarter of 2009. Just scanning the headlines gives a hint why investors are moving money into emerging markets: China up 9.6%, India 8.8%, Brazil 8.8%.

    The third-quarter advance estimate released today is based on source data that are incomplete or subject to further revision (the “second” estimate for the third quarter, based on more complete data, will be released on November 23, 2010).

    The increase in real GDP in the third quarter primarily reflected positive contributions from
    personal consumption expenditures (PCE), private inventory investment, nonresidential fixed
    investment, federal government spending, and exports that were partly offset by a negative contribution from residential fixed investment. Imports, which are a subtraction in the calculation of GDP, increased.

    The small acceleration in real GDP in the third quarter primarily reflected a sharp deceleration in imports and accelerations in private inventory investment and in PCE that were partly offset by a downturn in residential fixed investment and decelerations in nonresidential fixed investment and in exports.

    The price index for gross domestic purchases, which measures prices paid by U.S. residents,
    increased 0.8% in the third quarter, compared with an increase of 0.1% in the second. Real personal consumption expenditures increased 2.6% in the third quarter, compared
    with an increase of 2.2% in the second. Durable goods increased 6.1%, compared with an
    increase of 6.8%.

    Related: Initial 4th Quarter 2009 Data Show USA GDP Increased at 5.7% Annual RateFirst Quarter 2009 USA GDP Down 6.1%India Grew GDP 8.6% in First QuarterChina Economy Grows 11.9% in 1st Quarter
    (more…)

  • 12 Stocks for 10 Years: Oct 2010 Update

    The 12 stock for 10 years portfolio consists of stocks I would be comfortable putting into an IRA for 10 years. My main criteria was companies with a history of large positive cash flow, that seemed likely to continue that trend.

    In the original portfolio I created in April of 2005, I included Dell. Apple was one of the stocks I was considering but I chose not to include it. That has turned out to be a very bad mistake (though even with that the annualized return for the portfolio is beating the S&P 6%). As I have said the last few updates, I was considering dropping Dell. Since the last update, Dell has been dropped and replaced with Apple. This is the first decision to drop an original selection (First Data restructured and so it was removed).

    The current marketocracy* calculated annualized rate or return (which excludes Tesco) is 6.8% (the S&P 500 annualized return for the period is 2.6%) – marketocracy subtracts the equivalent of 2% of assets annually to simulate management fees – as though the portfolio were a mutual fund – so without that (it is not like this portfolio takes much management), the return beats the S&P 500 annual return by about 6.2% (it would be a bit less with Tesco, but still close to 6%).

    The current stocks, in order of return:

    Stock Current Return % of sleep well portfolio now % of the portfolio if I were buying today
    Amazon – AMZN 330% 11% 7%
    Google – GOOG 184% 17% 15%
    PetroChina – PTR 102% 7% 6%
    Templeton Dragon Fund – TDF 100% 11% 10%
    Templeton Emerging Market Fund – EMF 76% 6% 6%
    Danaher – DHR 22% 9% 10%
    Cisco – CSCO 18% 6% 7%
    Apple – AAPL 12% 5% 6%
    Tesco – TSCDY -2%** 0%* 10%
    Toyota – TM -5% 7% 10%
    Intel – INTC -8% 5% 8%
    Pfizer – PFE -27% 5% 7%

    The current marketocracy results can be seen on the Sleep Well marketocracy portfolio page.

    Related: 11 Stocks for 10 Years, July 2010 Update12 Stocks for 10 Years, July 2009 UpdateRetirement Savings Allocation for 2010posts on stocksinvesting books
    (more…)

  • Selling Covered Call Options

    Options strike most as exotic investment transactions. And some option strategies can be risky. But stock options can also be used in ways that are not risky. Call options give you the right to buy a stock at a certain price (the strike price) on, or before, a certain date (the expiration date). So if you want to speculate that a stock will go up in a short period of time you can buy call options. This is a risky investment strategy – though it can pay off well if you speculate correctly.

    Someone has to sell the call option. The seller gives the buyer the right to buy a stock at a certain price by a certain date. A speculator can do this and take the risk that the price will not rise to the level where a person chooses to exerciser their option. The also carries a significant risk, as if the stock price rises the speculator that sold the option has to either buy the option back (at a significant cost) or provide the stock (which they would have to purchase on the market). In order to trade in options you must be approved by the broker (at least in the USA) as an investor with the knowledge, finances and goals for which options trading is appropriate.

    An investor can also sell an option to buy a stock they own – this is called selling a covered call option. This means you get the price the speculator is willing to pay to buy the option and may have to sell the stock you own if the person holding the option chooses to exercise it.

    Lets look at an example. Lets say you own some Amazon stock. (more…)

  • Curious Cat Investing and Economics Carnival #10

    Welcome to the Curious Cat Investing and Economics Carnival: find useful recent personal finance, investing and economics blog posts.

    • Global Aging – “Over time, low birth rates lead not only to fewer children, but also to fewer working-age people just as the percentage of dependent elders explodes. This means that as population aging runs its course, it might well go from stimulating the economy to depressing it. Fewer young adults means fewer people needing to purchase new homes, new furniture, and the like, as well as fewer people likely to take entrepreneurial risks. ” (The economic consequences of demographic changes are enormous. Investors often fail to appreciate how important they are – John)
    • Google: A Free Cash Flow Analysis by Peter Mycroft Psaras – “I learned this trick by analyzing Warren Buffett’s purchase of International Dairy Queen and noticed that many of the investments he was making then were low capital expenditure/ high free cash flow machines.”
    • Oil Consumption by Country 1990-2009 by John Hunter – “The USA consumed 18.7 million barrels a day in 2009. Only China was also over 5 million barrels, they reached 8.2 million in 2009. Japan is next at 4.4 million.”
    • 9 lazy portfolios for UK investors – “You don’t need to pay for black box analytics that spit out your fully personalized, mean variance optimised, risk calibrated portfolio. You can just keep things simple and do it yourself.”
    • Where corn prices go (and that’s UP), meat prices will follow by Jim Jubak – “But it is good news for farm incomes as higher prices for corn and other commodities push up revenues. That’s good news for the stocks of Mosaic (MOS) and Agrium (AGU) in the fertilizer group, seed companies Monsanto (MON) and Syngenta (SYT), and farm equipment makers Deere (DE) and AGCO (AGCO).”
    • Three Small Financial Tweaks You Should Make Before Winter by Mark Riddix – “At a minimum, try to increase your [retirement] contribution 1% every year. Although you shouldn’t miss 1% every time you add it, over time those small increases become 5% and 10%, which means a big long-term boost to your investments.”
    • How to Avoid Lifestyle Inflation by Ryan Guina – “Live beneath your means. An increase in income does not change the fact that living beneath your means is the single most important step in financial independence.”
    • How to keep yourself from retiring broke – ” According to the Center for Retirement Research, Americans, who are between 32 and 64 years old now, will be short about $90,000 on average to retire comfortably and ‘on time’.”
    • Yield Curve by Robert Wasilewski – “You’ll find today’s spread is historically steep… The spread is the compensation that investors get for taking on price risk for buying longer maturities. Bond investors constantly assess whether the additional yield, i.e. spread, compensates for the incremental risk.”
    • Asset Allocation In A Rising Interest Rate Environment by Gaétan Ruest – “Typically, a shorter term bond will be less impacted in a rising interest rate environment than a long term bond. But this is only true if the increase in the short term interest rates is the same as at the long term.”

    Related: investing booksarticles on investingCurious Cat Investing and Economics Search

  • Government Debt as Percentage of GDP 1990-2009: USA, Japan, Germany, China…

    The world today has a much different economic landscape than just 20 years ago. China’s amazing economic growth is likely the biggest story. But the overwhelming success of many other countries is also a huge story. Today it is not the developing world that has governments spending taxes they promise their grandchildren will pay, but instead the richest countries on earth that choose to spend today and pay tomorrow. While “developing” countries have well balanced government budgets overall.

    graph showing government debt as percentage of GDPThe chart shows gross government debt as percentage GDP from 1990-2009. By Curious Cat Investing and Economics Blog, Creative Commons Attribution. Data source: IMF

    ___________________________

    There are plenty of reasons to question this data but I think it gives a decent overall picture of where things stand. It may seem like government debt should be an easy figure to know but even just agreeing what would be the most reasonable figure for one country is very difficult, comparing between countries gets even more difficult and the political pressures to reduces how bad the data looks encourages countries to try and make the figures look as good as they can.

    The poster child for irresponsible spending is Japan which has gross government debt of 218% of GDP (Japan’s 2009 figure is an IMF estimate). Greece is at 115%. Gross debt is not the only important figure. Government debt held within the country is much less damaging than debt held by those outside the country. Japan holds a large portion of its own debt. If foreigners own your debt then debt payments you make each year are paid outside your country and it is in essence a tax of a portion of your economic production that must be paid. If the debt is internal it mean taxpayers have to support bond holders each year (but at least when those bondholders spend the money it stays within your economy).
    (more…)

  • More Kiva Entrepreneur Loans: Kenya, Honduras, Armenia…

    I made several more Kiva loans to entrepreneur in Kenya, Lebanon, Nicaragua, Kenya, Honduras and Armenia (brining my total loans to 251). It really is great to see real people using capitalism to improve their lives. And being able to help by lending some money is wonderful. When looking for loans I give preference to loans that improve productivity and increasing capacity of the entrepreneur. If they use the proceeds of the loan to increase their capacity to produce they can pay off the loan and find themselves much better off.

    photo of Douglas Osusu and posho grinding millsDouglas Osusu, Kisii, Kenya, in front of his posho mill (used for grinding maize into flour).

    A nice example of this is the loan to Douglas Osusu (pictured). He has requested this loan of 80,000 KES to purchase a dairy cow and a posho mill. This loan also has a portfolio yield (Kiva’s equivalent of an annual percentage rate) of 19%. 19% is very loan for loans on Kiva (remember there are significant costs to servicing micro-loans) – I like the rate to be under 30% but sometimes accept rates up to 40% (or even higher occasionally). I also give great preference to low rates, as the lower the rate the better for the entrepreneur. The 3rd factor I consider is the history of the field partner bank (default rate, delinquency rate and currency exchange loss rate). In this case the field partner is new and carries risk because of that. Still in this case I really like the loan and I like that this lender is charging low rates so I want to take the risk and see how they can do. The amount I lend is based on the combination of these factors – I lend more when I have several reasons to really like the loan.

    Join other readers by making loans and joining the Curious Cats Lending Team: 8 members, 213 loans totaling $8,775. Comment with the link to your Kiva page and I will add a link on Curious Cat Kivans.

    My current default rate is 1.39% and the delinquency rate is 8.49% (see chart of USA general delinquency rates). The delinquency rate is exaggerated due to technical details (some difficulties in reporting in various countries and such things). Agricultural loans often become delinquent on Kiva but still are paid in full (in my experience). While the defaulted loan rate is 1.39% if you look at the percent of dollars lost I have a rate of 1.2% (this is nearly all due to a bank that failed over a year ago to which I had 2 loans where I lost $87.50 of $100 – there are also 2 other losses for under $5). I add to my total loan amount a couple times a year but also I get to keep relending as money is paid back.

    Some of my favorite ways to help reduce extreme poverty are Trickle Up, Kiva and using Global Giving to find small organizations.

    Related: 100th Entrepreneur LoanMore Kiva Entrepreneur Loans: Kenya, El Salvador (June 2010)Kiva Opens to USA Entrepreneur LoansMicroFinance Currency Risk – Kiva Fellows Blog: Nepalese Entrepreneur Success