Author: John Hunter

  • Move to Finland for Cell Phone Service Savings

    Ok, maybe moving to lower your cell phone bill would be a bit extreme. But the cost of cell phone service is almost 5 times as high in the USA as in Finland:
    Mobile phone calls lowest in Finland, Netherlands and Sweden

    Finland, the Netherlands and Sweden have the lowest prices for mobile phone calls among OECD countries, according to the latest OECD Communications Outlook. The highest were found in Canada, Spain and the United States.

    Comparing prices on a medium-use basis for a package of 780 voice calls, 600 short texts (SMS), and eight multimedia (MMS) messages, the survey found monthly prices ranged from 11 to 53 US dollars across countries as of August 2008.

    The OECD Communications Outlook says between 2006 and 2008 mobile phone call prices fell on average by 21% for low usage consumers, 28% for medium usage and by 32% for subscribers with the highest consumption patterns.

    Related: Kiss Your Phone Bill Good-byemoney saving ideasInvesting dictionary

  • Financial Services for the Poor from the Gates Foundation

    The behavior of banks is despicable enough when they are merely trying to trick educated, financially secure people out of their money. Banks charged $38.5 billion in fees last year according to the Financial Times. But that behavior, toward the poor, by banks (paying millions to hundreds of executives for, I guess, getting congress to send the companies billions) is immoral.

    The Gates Foundation has decided to go into improving financial services for the poor. The are supporting micro-credit but also micro finance. Saving is key for poor people to get and stay out of poverty. Most already save money informally but want better, safer options. Setting aside money in a safe place will allow poor people to weather setbacks, build assets and financial security, and invest in opportunities for the next generation. Formal savings accounts also help them keep more of what they earn and easily access their money when they need it.

    The poor need better banking options in poor countries. But the poor need better banking options in at least one rich country (the only one I know is the USA and banks in the USA provide lousy options for the poor). Credit Unions are much more likely to actually try and provide value to customers. Unfortunately banks in the USA seem to operate on the principle that customer are suckers that exist to pay for Porches for the children of bank executives.

    Related: FDIC Study of Bank Overdraft FeesMicrofinancing EntrepreneursIncredibly Bad Customer Service from Discover Card10 Things Your Bank Won’t Tell You

  • Commercial Real Estate Market Still Slumping

    Fed Focusing on Real-Estate Recession as Bernanke Convenes FOMC

    The collapse in commercial real estate is preventing Federal Reserve Chairman Ben S. Bernanke from declaring the economy and financial markets are healed. Property values have fallen 35 percent since October 2007, according to Moody’s Investors Service.

    Commercial property is “certainly going to be a significant drag” on growth, said Dean Maki, a former Fed researcher who is now chief U.S. economist in New York at Barclays Capital Inc., the investment-banking division of London-based Barclays Plc. “The bigger risk from it would be if it causes unexpected losses to financial firms that lead to another financial crisis.”

    Any sales of mortgage-backed bonds would be the first new issues in the $700 billion U.S. market for commercial-mortgage- backed securities since it was shut down by the credit freeze in 2008. About $3 billion are in the pipeline, and the success of these sales may foster as much as $25 billion in total deals in the next six months

    Forty-seven percent of loans at the 7,000-plus smaller U.S. lenders are in commercial real estate, compared with 17 percent for the biggest banks…

    Related: Data Shows Subprime Mortgages Were Failing Years Before the Crisis HitHome Values and Rental RatesRecord Home Price Declines (Sep 2008)

  • Unemployment Rate Drops Slightly to 9.4%

    The USA unemployment rate dropped slightly to 9.4%. The economy lost 247,000 jobs which is both a sign the economy is not strong and also that it is improving (job losses from November through April were 645,000/month and 331,000/month from May through July). The job losses for May and June were both revised to show 20,000 fewer job losses each in the press release from the Bureau of Labor Statistics.

    The number of long-term unemployed (those jobless for 27 weeks or more) rose by 584,000 over the month to 5.0 million. In July, 1 in 3 unemployed persons were jobless for 27 weeks or more.

    The employment-population ratio, at 59.4%, was little changed over the month but has declined by 330 basis points since the recession began in December 2007. About 2.3 million persons were marginally attached to the labor force in July, 709,000 more than a year earlier (The data are not seasonally adjusted). These individuals, who were not in the labor force, wanted and were available for work and had looked for a job sometime in the prior 12 months. They were not counted as unemployed because they had not searched for work in the 4 weeks preceding the survey.

    In July, the average workweek of production and nonsupervisory workers on private nonfarm payrolls edged up by 0.1 hour to 33.1 hours. The manufacturing workweek increased by 0.3 hour to 39.8 hours. Factory overtime was unchanged at 2.9 hours.

    This news supports the increasing livelihood of a weak recovery taking hold during 2009 – which is frankly pretty amazing in my opinion. The economy could certainly have taken longer to recover. Still, more job losses and an increasing unemployment rate are likely before the end of 2009.

    Related: Another 450,000 Jobs Lost in JuneUSA Unemployment Rate Jumps to 9.4% (May 2009)USA Unemployment Rate Rises to 8.1%, Highest Level Since 1983 (March 2009)
    (more…)

  • Bond Yields Show Dramatic Increase in Investor Confidence

    graph of 10 year Aaa, Baa and corporate bond rates from 2005-2009
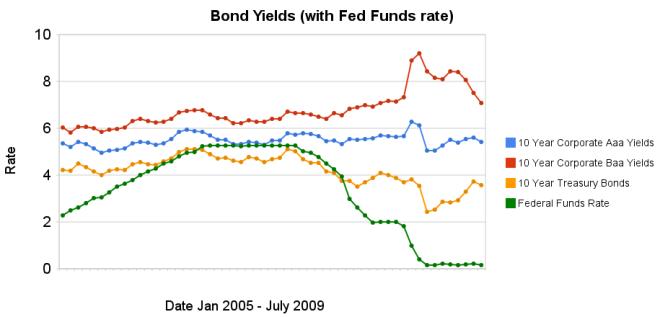
Chart showing corporate and government bond yields by Curious Cat Investing Economics Blog, Creative Commons Attribution, data from the Federal Reserve.

    The changes in bond yields over the last 3 months months indicate a huge increase in investor confidence. The yield spread between corporate Baa 10 year bonds and 10 year treasury bonds increased 304 basis points from July 2008 to December 2008, indicating a huge swing in investor sentiment away from risk and to security (US government securities). From April 2009 to July 2009 the yield spread decreased by 213 basis points showing investors have moved away from government bonds and into Baa corporate bonds.

    From April to July 10 year corporate Aaa yields have stayed essentially unchanged (5.39% to 5.41% in July). Baa yields plunged from 8.39% to 7.09%. And 10 year government bond yields increased from 2.93% to 3.56%. federal funds rate remains under .25%.

    Investors are now willing to take risk on corporate defaults for a much lower premium (over government bond yields) than just a few months ago. This is a sign the credit crisis has eased quite dramatically, even though it is not yet over.

    Data from the federal reserve: corporate Aaacorporate Baaten year treasuryfed funds

    Related: Continued Large Spreads Between Corporate and Government Bond Yields (April 2009)Chart Shows Wild Swings in Bond Yields (Jan 2009)investing and economic charts

  • Lazy Portfolios Seven-year Winning Streak

    Here is an excellent article on how to invest in the stock market. I personally tweak this advice a bit but it is much better than most advice you get. Basically keep costs down (don’t pay large fees) and diversify. Lazy Portfolios seven-year winning streak by Paul Farrell

    Greed drives this [mutual fund] industry. The “world’s largest skimming operation” has now lost over 50% of America’s savings in the decade since the peak of 2000. The track record of actively managed funds during the recent subprime-credit meltdown continues to prove that the industry is failing America. The only way to invest is with index funds, which make up just 14% of the total.

    In short, even though we know that the average compensation of portfolio managers is often $400,000 to more than a $1 million, the hot-shot managers of these actively managed funds provided no value-added to their funds’ performance. Conclusion: Their investors would be better off investing in index funds.

    Yes, the market was in negative territory the past few years, but still all eight Lazy Portfolios outperformed each of the six actively-managed funds.

    Customize your own Lazy Portfolio following these six rules and you’ll win. More important, you’ll have lots of time left to enjoy what really counts, your family, friends, career, sports, hobbies, living.

    2) Frugality, savings versus financial obesity. Tools like starting early, autopilot saving plans, dollar-cost averaging, frugal living and other tricks are familiar to long-term investors. Trust your frugality instincts — living below your means — it’s a trait common among America’s “millionaires next door.”

    Related: Lazy Portfolio Results (April 2008)Allocations Make A Big Difference12 stocks for 10 years401(k)s are a Great Way to Save for Retirement

  • Retirement Planning – How Secure Are You?

    Wells Fargo is offering to donate $1 to Kiva for every person that completes a 7 question survey (no contact information is required) to get what they call a retirement security index. I did and there are 2 benefits to doing so yourself. First, most of us would benefit from more attention to our retirement planning. Second help out Kiva – which I have mentioned many time.

    Now I think their questionnaire is far too simplistic but it is hard to get people to spend even 15 minutes looking at a saving plan for retirement. So I know they are trying to keep it very simple so people will complete it. That said, read our posts on retirement planning to lean more about planning for retirement. It is critical that you spend the time in your 20’s, 30’s and 40’s doing this or you are really going to have trouble making decent retirement plans.

    Related: Add to Your 401(k) and IRASpending Guidelines in RetirementRetirement Savings Survey ResultsPersonal Finance: Saving for Retirement

  • Apartment Vacancy at 22-Year High in USA

    Apartment Vacancy at 22-Year High in U.S.

    Vacancies climbed to 7.5 percent from 6.1 percent a year earlier, New York-based real estate research firm Reis Inc. said today. The last time landlords had so much empty space was in 1987, when vacancies reached 7.6 percent

    Asking rents for apartments fell 0.6 percent in the second quarter from the first, Reis said. That matched the rate of change in the first quarter, the biggest drop since Reis began reporting such data in 1999.

    New York had the lowest vacancy rate in the second quarter, at 2.9 percent, followed by New Haven, home to Yale University; Central New Jersey; New York’s Long Island; and Syracuse, New York, according to Reis.

    Related: Housing Rents Falling in the USARent Controls are UnwiseIt’s Now a Renter’s Marketarticles on investing and real estate

  • SEC Curtails Abusive Short Sales

    Short selling stock is a tool that can help keep markets more stable. However, short selling can be used to manipulate the market and in the last decade naked short selling has contributed to such manipulation. The SEC has made permanent a temporary rule that was approved in 2008 in response to continuing concerns regarding “fails to deliver” and potentially abusive “naked” short selling. In particular, temporary Rule 204T made it a violation of Regulation SHO and imposes penalties if a clearing firm:

    * does not purchase or borrow shares to close-out a “fail to deliver”
    * resulting from a short sale in any equity security
    * by no later than the beginning of trading on the day after the fail first occurs (Trade + 4 days).

    Cutting Down Failures to Deliver: An analysis conducted by the SEC’s Office of Economic Analysis, which followed the adoption of the close-out requirement of Rule 204T and the elimination of the “options market maker” exception, showed the number of “fails” declined significantly.

    For example, since the fall of 2008, fails to deliver in all equity securities has decreased by approximately 57 percent and the average daily number of threshold list securities has declined from a high of approximately 582 securities in July 2008 to 63 in March 2009. Which still is not acceptable, in my opinion. In general this is a good move by the SEC, but still not sufficient.

    Transparency is increased some by the SEC with the new rules:

    * Daily Publication of Short Sale Volume Information. It is expected in the next few weeks that the SROs will begin publishing on their Web sites the aggregate short selling volume in each individual equity security for that day.
    * Disclosure of Short Sale Transaction Information. It is expected in the next few weeks that the SROs will begin publishing on their Web sites on a one-month delayed basis information regarding individual short sale transactions in all exchange-listed equity securities.
    * Twice Monthly Disclosure of Fails Data. It is expected in the next few weeks that the Commission will enhance the publication on its Web site of fails to deliver data so that fails to deliver information is provided twice per month and for all equity securities, regardless of the fails level.

    Full SEC press release: SEC Takes Steps to Curtail Abusive Short Sales and Increase Market Transparency

    Related: SEC Temporarily Bans Short-selling Financial StocksShorting Using Inverse FundsToo Much Leverage Killed Mervyns

  • 12 Stocks for 10 Years – July 2009 Update

    I originally setup the 10 stocks for 10 years portfolio in April of 2005. In order to track performance created a marketocracy portfolio but had to make some minor adjustments (and marketocracy doesn’t allow Tesco to be purchased, though it is easily available as an ADR to anyone in the USA to buy in real life – it is based in England). The current marketocracy calculated annualized rate or return (which excludes Tesco) is 3.5% (the S&P 500 annualized return for the period is -1.7%) – marketocracy subtracts the equivalent of 2% of assets annually to simulate management fees – as though the portfolio were a mutual fund – so without that the return is about 5.5%).

    The current stocks, in order of return:

    Stock Current Return % of sleep well portfolio now % of the portfolio if I were buying today
    Amazon – AMZN 136% 9% 9%
    Google – GOOG 105% 15% 13%
    Templeton Dragon Fund – TDF 80% 11% 11%
    PetroChina – PTR 78% 11% 10%
    Templeton Emerging Market Fund – EMF 28% 5% 6%
    Cisco – CSCO 15% 6% 8%
    Toyota – TM 7% 9% 11%
    Danaher – DHR -14% 6% 9%
    Tesco – TSCDY -14%* 0%* 10%
    Intel – INTC -15% 4% 6%
    Pfizer – PFE -38% 5% 7%
    Dell -60% 4% 0%

    The portfolio is beating the S&P 500 by 5.2% annually (which is actually quite good. Also it is a bit confused due to to Tesco not being included. View the current marketocracy Sleep Well portfolio page.

    Related: 12 Stocks for 10 Years Update – June 2008posts on stocksinvesting books
    (more…)