Blog

  • USA Spent a Record $2.7 Trillion, $8,680 per person, 17.9% of GDP on Health Care in 2011

    USA health care spending continues to grow, consuming an ever increasing share of the economic production of the USA. USA health care spending is twice that of other rich countries for worse health care results.

    • USA health care expenditures grew 3.9% to $2.7 trillion in 2011, or $8,680 per person, and accounted for 17.9% of Gross Domestic Product (GDP).
    • Medicare spending grew 6.2% to $554.3 billion in 2011, to 21% of total health care spending.
    • Medicaid spending grew 2.5% to $407.7 billion in 2011, or 15% of total health care spending.
    • Private health insurance spending grew 3.8% to $896.3 billion in 2011, or 33 percent of total health care expenditures.
    • Out of pocket spending grew 2.8% to $307.7 billion in 2011, or 11 percent of total health care spending.
    • Hospital expenditures grew 4.3% to $850.6 billion in 2011.
    • Physician and clinical services expenditures grew 4.3% to $541.4 billion in 2011.
    • Prescription drug spending increased 2.9% to $263.0 billion in 2011.
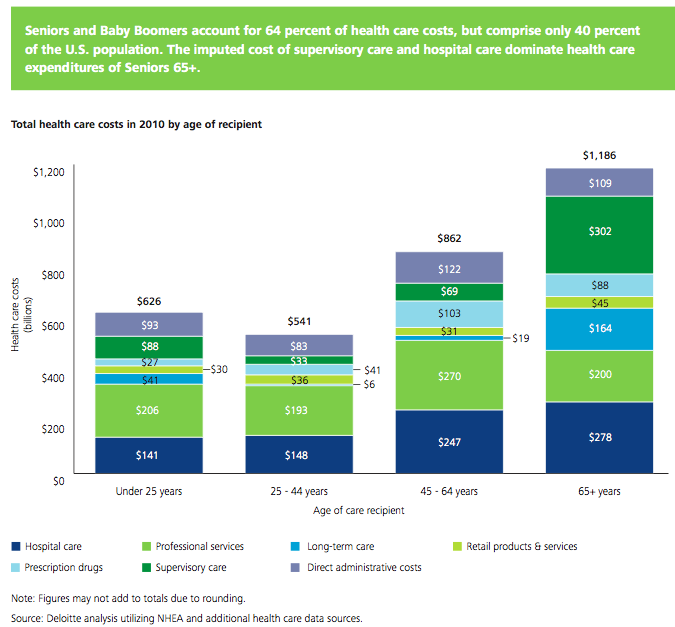
    • Per person personal health care spending for the 65 and older population was $14,797 in 2004, 5.6 times higher than spending per child ($2,650) and 3.3 times spending per working-age person ($4,511).

    Individuals (28%) and the federal government (28%) accounted for the largest share of those paying for health care in the USA. Businesses pay 21% of the costs of health care while state and local governments pay 17%.

    The United States Centers for Medicare & Medicaid Services (CMS) project that health care spending will rise to 19.6% of GDP by 2021. Since the long term failure of the USA health care system has resulted in costs increasing faster than inflation every year for decades, it seems reasonable to expect that trend to continue. The burden on the USA grows more and more harmful to the USA each year these rising costs continue.

    In 2004, the elderly (65 years old and older) accounted for 12% of the population, and accounted for 34% of spending.

    Data from US CMS (sadly the way they provide the data online my guess is this url will fail to work in a year, as they post the updated data – I don’t see a way to provide a link to a url with persistent data).

    Half of the population spends little or nothing on health care, while 5% of the population spends almost half of the total amount (The High Concentration of U.S. Health Care Expenditures: Research in Action).

    Related: USA Spends Record $2.5 Trillion, $8,086 per person 17.6% of GDP on Health Care in 2009USA Spent $2.2 Trillion, 16.2% of GDP, on Health Care in 2007USA Health Care Costs reach 15.3% of GDP – the highest percentage ever (2005)Systemic Health Care Failure: Small Business Coverage

  • Top Nations for Retirement Security of Their Citizens

    Across the globe, saving for retirement is a challenge. Longer lives and expensive health care create challenge to our natures (saving for far away needs is not easy for most of us to do – we are like the grasshopper not the ants, we play in the summer instead of saving). This varies across the globe, in Japan and China they save far more than in the USA for example.

    The United States of America ranks 19th worldwide in the retirement security of its citizens, according to a new Natixis Global Retirement Index. The findings suggest that Americans will need to pick up a bigger share of their retirement costs – especially as the number of retirees grows and the government’s ability to
    support them fades. The gauges how well retired citizens live in 150 nations, based on measures of health, material well-being, finances and other factors.

    Top Countries for Retirees

    • 1 – Norway
    • 2 – Switzerland
    • 3 – Luxembourg
    • 6 – Finland
    • 9 – Germany
    • 10 – France
    • 11 – Australia
    • 13 – Canada
    • 15 – Japan
    • 19 – USA
    • 20 – United Kingdom

    Western European nations – backed by robust health care and retiree social programs – dominate the top of the rankings, taking the first 10 spots, including Sweden, Austria, Netherlands and Denmark. The USA finished ahead of the United Kingdom, but trailed the Czech Republic and Slovakia.

    Globally, the number of people aged 65 or older is on track to triple by 2050. By that time, the ratio of the working-age population to those over 65 in the USA is expected to drop from 5-to-1 to 2.8-to-1. The USA actually does much better demographically (not aging as quickly) as other rich countries mainly due to immigration. Slowing immigration going forward would make this problem worse (and does now for countries like Japan that have very restrictive immigration policies).

    The economic downturn has taken a major toll on retirement savings. According to a recent report by the U.S. Senate Committee on Health, Education, Labor and Pensions, the country is facing a retirement savings deficit of $6.6 trillion, or nearly $57,000 per household. As a result, 53% of American workers 30 and older are on a path that will leave them unprepared for retirement, up significantly from 38% in 2011.

    On another blog I recently wrote about another study looking at the Best Countries to Retirement Too: Ecuador, Panama, Malaysia. The study in the case was looking not at the overall state of retirees that worked in the country (as the study discussed in this post did) but instead where expat retirees find good options (which stretch limited retirement savings along with other benefits to retirees).

    See the full press release.

    Related: Top Stock Market Capitalization by Country from 1990 to 2010Easiest Countries in Which to Operate a Businesses: Singapore, Hong Kong, New Zealand, USALargest Nuclear Power Generation Countries from 1985-2010Leading countries for Economic Freedom: Hong Kong, Singapore, New Zealand, SwitzerlandCountries with the Top Manufacturing Production

  • How Much of Current Income to Save for Retirement

    Determining exactly what needs to be saved for retirement is tricky. Basically it is something that needs to be adjusted based on how things go (savings accumulated, saving rate, planned retirement date, investing returns, predicted investing returns, government policy, tax rates, etc.). The simple idea is start by saving 15% of salary by the time you are 30. Then adjust over time. If you start earlier maybe you can get by with 12%…

    How Much to Save for Retirement is a very good report by the Boston College center for retirement research. They look at the percent of income replacement social security (for those in the USA) provides. This amount varies greatly depending on your income and retirement (date you start drawing social security payments).

    Low earners ($20,000) that retire at 65 have 49% of income replaced by social security. Waiting only 2 years, to 67, the replacement amount increases to 55%. For medium earners ($50,000) 36% and 41% of income is replaced. And for high earners ($90,000) 30% an 34%.

    Starting savings early make a huge difference. Starting retirement savings at age 25 requires about 1/3 the percentage of income be saved as starting at 45. So you can save for example 7% from age 25 to 70 or 18% from age 45 to 70. Retiring at 62 versus 70 also carries a cost of about 3 times as great savings required each year. So retiring at 62 would require an impossible 65% if you didn’t start saving until 45. But these numbers are affected by many things (the higher your income the less social security helps so the higher percentages you need to save and many other factors play a role).

    Starting to save early is a huge key. Delaying retirement makes a big difference but it is not nearly as much in your control. You can plan on doing that but need to understand that you cannot assume you will get to set the date (either because finding a job you can do and pays what you wish is not easy or you are not healthy enough to work full time).

    If you don’t have social security (those outside the USA – some countries have their versions but some don’t offer anything) you need to save more. A good strategy is to start saving for retirement in your twenties. As you get raises increase your percentage. So if you started at 6% (maybe 4% from you and a 2% match, but in any event 6% total) each time you get a raise increase your percentage 100 basis points (1 percentage point).

    If you started at 27 at 6% and got a raise each year for 9 years you would then be at 15% by age 36. Then you could start looking at how you were going and make some guesstimates about the future. Maybe you could stabilize at 15% or maybe you could keep increasing the amount. If you can save more early (start at 8% or increase by 150 or 200% basis points a year) that is even better. Building up savings early provides a cushion for coping with negative shocks (being unemployed for a year, losing your job and having to take a new job earning 25% less, very bad decade of investing returns, etc.).

    Investing wisely makes a big difference also. The key for retirement savings is safety first, especially as you move closer to retirement. But you need to think of investment safety as an overall portfolio. The safest portfolio is well balanced not a portfolio consisting of just an investment people think of as safe by itself.

    Related: Retirement Planning, Investing Asset ConsiderationsSaving for Retirement Must Be a Personal Finance PriorityInvestment Risk Matters Most as Part of a Portfolio, Rather than in Isolation

  • Curious Cat Investing, Economics and Personal Finance Carnival #41

    Enjoy this edition of the Curious Cat Investing, Economics and Personal Finance Carnival. This carnival is different than many blog carnivals: I select posts on those topics from what I read (instead of posting those that submit to the carnival as many carnivals do). If you would like to host the carnival add a comment below.

    Statue at Sri Krishnan Temple in Singapore
    Sri Krishnan Temple, Singapore
    • The Economics of Netflix’s $100 Million New Show – “ith Netflix spending a reported $100 million to produce two 13-episode seasons of House of Cards, they need 520,834 people to sign up for a $7.99 subscription for two years to break even.”
    • Chart of Top Countries for Manufacturing Production 1999-2011 by John Hunter – “the four leading nations for manufacturing production remain solidly ahead of all the rest. Korea and Italy had manufacturing output of $313 billion in 2011 and Brazil moved up to $308 are in 4-6 place. Those 3 countries together could be in 4th place (ahead of just Germany). Even adding Korea and Italy together the total is short of Germany by $103 billion.”
    • Why a Transaction Fee Matters to You by David Brin – “By raw extrapolation, this zero-point-zero-three-percent (0.03%) fee could raise a whopping deficit-curbing $352 billion dollars in ten years, while helping capital markets to settle down” [I agree we should use a very small fee to raise money and reduce incentive for high frequency trading/frontrunning – John]
    • Mexico: The New China – “Today, what Shenzhen is to Hong Kong, Tijuana is becoming to San Diego. You can drive from our San Diego engineering center to our Tijuana factory in 20 minutes, no passport required. (A passport is needed to come back, but there are fast-track lanes for business people.)”
    • (more…)

  • Manufacturing Output by Country 1999-2011: China, USA, Japan, Germany

    Chart of manufacturing output from 1999 to 2011 for China, USA, Japan and Germany
    Chart of manufacturing production by China, USA, Japan and Germany from 1999 to 2011. The chart was created by the Curious Cat Economics Blog using UN data. You may use the chart with attribution. All data is shown in current USD (United States Dollar).

    The story of global manufacturing production continues to be China’s growth, which is the conventional wisdom. The conventional wisdom however is not correct in the belief that the USA has failed. China shot past the USA, which dropped into 2nd place, but the USA still manufactures a great deal and has continually increased output (though very slowly in the last few years).

    The story is pretty much the same as I have been writing for 8 years now. The biggest difference in that story is just that China actually finally moved into 1st place in 2010 and, maybe, the slowing of the USA growth in output (if that continues, I think the USA growth will improve). I said last year, that I expected China to build on the lead it finally took, and they did so. I expect that to continue, but I also wouldn’t be surprised to see China’s momentum slow (especially a few more years out – it may not slow for 3 or 4 more years).

    As before, the four leading nations for manufacturing production remain solidly ahead of all the rest. Korea and Italy had manufacturing output of $313 billion in 2011 and Brazil moved up to $308 are in 4-6 place. Those 3 countries together could be in 4th place (ahead of just Germany). Even adding Korea and Italy together the total is short of Germany by $103 in 2011). I would expect Korea and Brazil to grow manufacturing output substantially more than Italy in the next 5 years.

    (more…)

  • 157,000 Jobs Added in January and Adjustments for the Prior Two Months add 127,000 More

    Total nonfarm payroll employment increased by 157,000 in January, and the unemployment rate was essentially unchanged at 7.9%, the USA Bureau of Labor Statistics reported today. The change in total nonfarm payroll employment for November was revised from +161,000 to +247,000, and the change for December was revised from +155,000 to +196,000 which means this report shows an increase of 284,000 (157+86+41). In 2012, employment growth averaged 181,000 per month.

    The number of unemployed persons, at 12.3 million, was little changed in January. The
    unemployment rate was 7.9% and has been at or near that level since September 2012.

    Among the major worker groups, the unemployment rates for adult men (7.3%), adult women (7.3%), teenagers (23.4%), whites (7.0%), african-american (13.8%), Hispanics (9.7%), and Asians (6.5%) showed little or no change in January.

    In January, the number of long-term unemployed (those jobless for 27 weeks or more) was about unchanged at 4.7 million and accounted for 38.1% of the unemployed. The continued high level of long term unemployment is a continuing concern.

    Health care continued to add jobs in January (+23,000). Within health care, job growth occurred in ambulatory health care services (+28,000), which includes doctors’ offices and outpatient care centers. In the last year, health care employment has increased by 320,000.

    Manufacturing employment was essentially unchanged in January and has changed little, on net, since July 2012.

    Average hourly earnings for all employees on private nonfarm payrolls rose by 4 cents to $23.78. Over the year, average hourly earnings have risen by 2.1 percent. In January, average hourly earnings of private-sector production and nonsupervisory employees increased by 5 cents to $19.97.

    Related: 243,000 Jobs Added in January 2012 to Bring the USA Unemployment Rate Down to 8.3%USA Unemployment Rate Remains at 9.7% (Feb 2010)What Do Unemployment Stats Mean?

  • Is it Time to Sell Apple?

    No, it is not time to sell Apple, if your portfolio is not already too heavily overweighted in Apple it would make sense to buy. There is about as much wrong with Apple today as Toyota 3 years ago, which means essentially nothing is wrong. Yes, neither company is perfect. Maybe people were carried away with how awesome Apple was, but I don’t think the stock price every was.

    Apple was a great buy at $700. Of course in the same situation buying it at $500 would be even better. I think it is a great buy at $500 today. I think Apple is going to move ahead just as Toyota has the last few years. The people jumping around at every single rumor of a data point are going beyond reacting to each data point they are reacting to rumors of data points.

    I could be wrong. If Apple’s earnings cave over the next 5 years people can claim they say early signals. After a long time watching investors react to data and rumors and speculation I think they are just being foolish. Even if Apple is deteriorating, there needs to be a much better explanation for why investors should believe that than I have seen.

    The best reason to question Apple is how long of a run they are on. Figuring the “law” of convergence in mean should make investors wary. That isn’t really true but that idea – that you just don’t stay on such a run (especially when you are huge and the have the largest market capitalization in the world).

    But that is more just saying Toyota can’t keep being awesome. There is some sense that most likely they will stumble. But the problem is it is more likely about every other company will stumble first. The winners keep winning more than they start failing. But they also do often start failing. 100 years from now there is a decent chance Apple doesn’t exist. But there is a greater change most of the other companies you can invest in won’t. And there is a greater chance most other investments will do worse than Apple. That is my guess. Other investors get to place their money where there mouth is and we will see in 5 and 10 years how things stand.

    I’ll stick with Apple and Toyota and Google and Danaher and Intel and….

    Related: Apple’s Earning are Again Great, Significantly Exceeding High Expectations (April 2012)Apple Tops Google (Aug 2008)12 Stocks for 10 Years: Oct 2010 Update

  • Health Care Costs Continue to Grow Including Costs Missed in Economic Data

    A recent report by Deloitte, The Hidden Costs of U.S. Health Care: Consumer Discretionary Health Care Spending provides some interesting data.

    Between 2006 and 2010 USA health care expenditures increased by 19%. Government spending accounted for 40% of costs (remember that figure is lowered due to Deloitte’s including inputed value for care of relatives). Those 65 and older account for 61% of the inputed cost care that is provided.

    chart of USA health care spending by age group
    Seniors and baby boomers account for 64% of health care costs, but comprise only 40% of the USA population. The imputed cost of supervisory care and hospital care are far higher proportions of health care expenditures of seniors (65 and older).
    An additional $621 billion in direct and indirect costs was estimated for goods and services above what is captured in NHEA accounting. Of this additional amount, $492 billion (79 percent) is the imputed value of unpaid supervisory care given to individuals by family or friends.

    I find this imputed value largely not worth considering. There are problems with the way we count GDP and economic activity (that affect health care and lots of other things). It is fine to be aware that they think $492 billion of extra care is given by family members but using that figure in any sensible way (other than saying hey there is a huge cost in people’s time to dealing with our health care system and sick people that isn’t counted in economic data) is questionable.

    It is useful in looking at the increasingly old population we will see in the future and judging their is a large need for supervisory care that is not captured in just looking at the costs included in economic data currently. Not only will our grandkids have to pay for our living beyond our means today they will have to do so while providing unpaid care to their parents and grandparents.

    The burden of long term supervisor care (that which can be provided by a non-health care professional) is one reason a resurgence in multi-generation housing options make sense to me. There are other good reasons also (child care, socialization, financial support to the young…). There are some real advantages and real disadvantages to such options. But I think economic advantages are going to encourage more of this going forward.

    Related: Personal Finance Basics: Long-term Care InsuranceHealth Care in the USA Cost 17.9% of GDP, $2.6 Trillion, $8,402 per person in 2010Resources for Improving Health Care System Performance

  • Lavishing Tax Cuts on Ourselves That Our Grandkids Have to Pay For is Bad Policy

    Those that want to continue the policies of the last few decades of policies that tax our grandkids to pay for us living beyond our means seem to have won the day again. Not a surprise; very sad though.

    In my reading stories on the wonderful success of “avoiding the fiscal cliff” seems to amount to passing the George Bush tax cuts again (except this time when in a much much worse budgetary position) and modifying the extent to which the absolute richest benefit from those cuts (so the richest don’t get quite as step cuts as they had been getting but still are getting big cuts from before the Bush tax cuts were made. And the recent trend of treating trust fund babies as the absolute most favored taxpayers was continued (though a few of the absolute richest trust fund babies will have to have some taxes withheld from their windfalls).

    I haven’t read anything about them getting rid of the “hedge fund manager” tax favors. Did they? Did they even bother to change the law so retired managers don’t get the super huge tax favors too?

    On the spending beyond our means issue they seem to have just decided that having the grandkids continue to fund our spending is wonderful.

    If it were up to me I would have continued some of the Bush tax cuts (certainly not for those making more than $200,000 – unless we can cut spending way more than I would guess in which case I would be fine having taxes even for the richest few lowered). I would have continued treatment that reduced taxes owed on dividends and capital gains, though perhaps a bit less than they did. I would cap mortgage deductions (at say $50,000 a year or something).

    I certainly would not have supported such massive Bush tax cuts without large spending cuts. If this level of spending is what we intent to do, we need to pay for it and not just bury our kids and grandkids with huge bills. Without spending cuts I would not have voted again for the Bush tax cuts, which seems to be the main extent of their “solution” (taking a bit of the tax cuts for the wealthiest off the plate but pretty much just passing Bush’s tax cut again).

    (more…)

  • Curious Cat Investing, Economics and Personal Finance Carnival #40

    The Curious Cat Investing, Economics and Personal Finance carnival is published monthly with links to new, related, interesting content online.

    • Health-care bill in retirement: $240,000 by Elizabeth O’Brien – “Here’s a breakdown of where their $240,000 goes: 32% goes to premiums for Medicare Parts B & D, which cover doctor visits and drugs, respectively; 23% goes to prescription drugs expenses not covered by Medicare Part D; and 45% goes toward Medicare cost-sharing provisions, including copayments, deductibles, other services not covered by Medicare, and any optional Medigap policies purchased.

      For all their detail, Fidelity and EBRI’s retirement health-care estimates have a whopping exclusion: the cost of long-term care, which could be provided at home or in an assisted living or nursing facility.”

    • We’re Headed For A Disaster Of Biblical Proportions by Henry Blodget – “The rise in population, the ten-fold increase in wealth in developed countries, and the current explosive growth in developing countries have eaten rapidly into our finite resources of hydrocarbons and metals, fertilizer, available land, and water.”
    • photo of street art of spaceman in space
      Street art, Yogyakarta, Indonesia by John Hunter
    • Save What You Can, Increase Monthly Savings as You Can Do So by John Hunter – “My favorite tips along these lines are: spend less than you make, save some of every raise you get…”
    • A Better Way to Deliver Aid by Dr. William Brindley and Douglas Sabo – “To increase the speed of delivery and put decision-making power into the hands of beneficiaries, the international aid community has made a concerted effort over the last decade to transition away from the distribution of in-kind goods to the direct transfer of cash payments to assist those in need”
    • (more…)