Blog

  • Manufacturing Driving USA Recovery

    Durables Orders, Home Sales Probably Rose: U.S. Economy Preview

    “Manufacturing is coming back pretty solidly and there is some strength in capital spending,” said Mark Vitner, a senior economist at Wells Fargo Securities LLC in Charlotte, North Carolina. “Housing is definitely a laggard. Until we get job growth and lending eases up, we’re not going to get a whole lot of lift.”

    Federal Reserve Bank of New York President William Dudley last week indicated policy makers are more concerned about maintaining growth than they are about immediate inflation threats.

    Manufacturing, which accounts for 12 percent of the economy, expanded in January at the fastest pace since August 2004, according to the Institute for Supply Management’s factory index released Feb. 1.

    Some manufacturers are also beginning to bring back workers or hire. Caterpillar, the world’s largest maker of bulldozers and excavators, is recalling about 100 laid-off technicians at an Indiana plant because of increased demand and may be hiring more, Bridget Young, a Caterpillar spokeswoman, said Feb. 18.

    “Caterpillar may be recalling or hiring employees in business units at various facilities this year based on demand fluctuation,” Young said.

    Factories added 11,000 workers to payrolls in January, the first increase in three years and the most since April 2006, the Labor Department said on Feb. 5. Overall, payrolls declined by 20,000, and the unemployment rate fell to 9.7 percent.

    Obviously the economic disaster we had been poised to experience due to failed government action the last 10 years and excessive speculation by bankers and wall street has been averted in the short term. But the failure to take seriously the huge risks failed policies (bought by special interests from politicians) put our economy in leaves us at great risk for future problems. The ability to avert disaster so far has been very successful but the danders are still large. But right now the 2010 economy is looking much better than anyone could have hoped for a year ago when disaster seemed likely.

    The problem is that now those politicians, that collected huge payments for the last 20 years for those they have provided huge benefits to (allowing them to carry out strategies that risk the economic well being of the country, bailing them out if the gamblers lose, allowing tens of billion of dollars is profits due to extremely low short term interest rates, that allow dishonest credit card practices, providing tax benefits to the rich that pay the politicians well…), are acting as though the disastrous practices of those they are in bed with are fine. They are setting us up to repeat the same thing again. Which is really not that big a surprise given the lack of character of those we chose to elect.

    Manufacturing has been a strong part of why the economy has been so strong the last few decades. But the politicians has sought to allow those that pay them well to engage in practices that ruin the economy for the benefit of a few speculators.

    Related: Global Manufacturing Employment Data from 1979 to 2007Corrupt Officials Have Fled China With As Much As $100 billionWhy Pay Taxes or be HonestEstate Tax Repeal (another payoff to the rich paying politicians for favors)

  • Mortgage Delinquencies and Foreclosures Data Indicates 2010 Could Show Improvement

    The delinquency rate for mortgage loans on one-to-four-unit residential properties fell to a seasonally adjusted rate of 9.5% of all loans outstanding as of the end of the fourth quarter of 2009, down 17 basis points from the third quarter of 2009, and up 159 basis points from one year ago, according to the Mortgage Bankers Association’s (MBA) National Delinquency Survey. The non-seasonally adjusted delinquency rate increased 50 basis points from 9.9% in the third quarter of 2009 to 10.4% this quarter.

    The delinquency rate includes loans that are at least one payment past due but does not include loans in the process of foreclosure. The percentage of loans in the foreclosure process at the end of the fourth quarter was 4.6%, an increase of 11 basis points from the third quarter of 2009 and 128 basis points from one year ago. The combined percentage of loans in foreclosure or at least one payment past due was 15% on a non-seasonally adjusted basis, the highest ever recorded in the MBA delinquency survey.

    The percentage of loans on which foreclosure actions were started during the fourth quarter was 1.2 percent, down 22 basis points from last quarter and up 12 basis points from one year ago.

    The percentages of loans 90 days or more past due and loans in foreclosure set new record highs. The percentage of loans 30 days past due is still below the record set in the second quarter of 1985.

    The data is far from good but it could well signal the situation is improving. The next few quarters seem poised to start showing better results. Granted given how bad these results are we have a long way to go before the data is actually good. “We are likely seeing the beginning of the end of the unprecedented wave of mortgage delinquencies and foreclosures that started with the subprime defaults in early 2007, continued with the meltdown of the California and Florida housing markets due to overbuilding and the weak loan underwriting that supported that overbuilding, and culminated with a recession that saw 8.5 million people lose their jobs,” said Jay Brinkmann, MBA’s chief economist.

    “The continued and sizable drop in the 30-day delinquency rate is a concrete sign that the end may be in sight. We normally see a large spike in short-term mortgage delinquencies at the end of the year due to heating bills, Christmas expenditures and other seasonal factors. Not only did we not see that spike but the 30-day delinquencies actually fell by 16 basis points from 3.79% to 3.63%. Only three times before in the history of the MBA survey has the non-seasonally adjusted 30-day delinquency rate dropped between the third and fourth quarter and never by this magnitude.

    “This drop is important because 30-day delinquencies have historically been a leading indicator of serious delinquencies and foreclosures. With fewer new loans going bad, the pool of seriously delinquent loans and foreclosures will eventually begin to shrink once the rate at which these problems are resolved exceeds the rate at which new problems come in. It also gives us growing confidence that the size of the problem now is about as bad as it will get.

    “Despite the drop in short-term delinquencies, foreclosure rates could continue to climb, however, based on the ability of borrowers 90 days or more delinquent to solve their problems. A sizable number of the loans in the 90+ day delinquent bucket are in loan modification programs. They are carried as delinquent until borrowers demonstrate they will make the payments agreed to in the plans.

    Related posts: Mortgage Delinquencies Continue to Climb (Nov 2009)USA Housing Foreclosures Slowly Declining (Dec 2009)Nearly 10% of Mortgages Delinquent or in ForeclosureHow Not to Convert Equity (Jan 2006)
    (more…)

  • USA State Governments Have $1,000,000,000,000 in Unfunded Retirement Obligations

    There was a $1 trillion gap at the end of fiscal year 2008 between the $2.35 trillion states had set aside to pay for employees’ retirement benefits and the $3.35 trillion price tag of those promises, according to a new report released by the Pew Center on the States. The shortfall, which will have to be paid over the next 30 years by state and local governments, amounts to more than $8,800 for every household in the United States.

    The figures detailed in Pew’s report, The Trillion Dollar Gap, include pension, health care and other non-pension benefits promised to both current and future retirees in states’ and participating localities’ public sector retirement systems.

    Pew’s numbers likely underestimate the bill coming due because the most recent available data do not account for the second half of 2008, when states’ pension fund investments were particularly affected by the financial crisis. Additionally, most states’ accounting methods spread the investment declines over a period of time–meaning states will be dealing with their losses for several years.

    “While the economic crisis and drop in investments helped create it, the trillion dollar gap is primarily the result of states’ inability to save for the future and manage the costs of their public sector retirement benefits,” said Susan Urahn, managing director, Pew Center on the States. “The growing bill coming due to states could have significant consequences for taxpayers—higher taxes, less money for public services and lower state bond ratings. States need to start exploring reforms.”

    In fiscal year 2008, states’ pension plans had $2.8 trillion in long-term liabilities, with more than $2.3 trillion reserved to cover those costs. Overall, states’ pension systems were 84 percent funded—above the 80 percent funding level recommended by experts. Still, the unfunded portion–$452 billion–is substantial, and states’ performance is down slightly from an 85 percent combined funding level in fiscal year 2006. Pension liabilities have grown by $323 billion since 2006, outpacing asset growth by almost $87 billion.

    Retiree health care and other non-pension benefits, such as life insurance, create another huge bill coming due: a $587 billion total liability to pay for current and future benefits, with only $32 billion–or just over 5 percent of the cost–funded as of fiscal year 2008. Half of the states account for 95 percent of the liability. Because of a 2004 Governmental Accounting Standards Board rule, the full range of non-pension liabilities was officially reported in fiscal year 2008 for the first time across all 50 states.

    Many state and local governments continue to provide very large pay to state and local government employees and often use very generous retirement packages as a way of disguising the true cost of the pay packages they provide.

    Related: NY State Raises Pension Age to Save $48 BillionTrue Level of USA Federal DeficitCharge It to My KidsUSA Federal Debt Now $516,348 Per HouseholdPoliticians Again Raising Taxes On Your ChildrenConsumer Debt Reduced below $2.5 Trillion
    (more…)

  • USA, China and Japan Lead Manufacturing Output in 2008

    Once again the USA was the leading country in manufacturing in 2008. And once again China grew their manufacturing output amazingly. In a change with recent trends Japan grew output significantly. Of course, the 2009 data is going to show the impact of a very severe worldwide recession.

    Chart showing percent of output by top manufacturing countries from 1990 to 2008
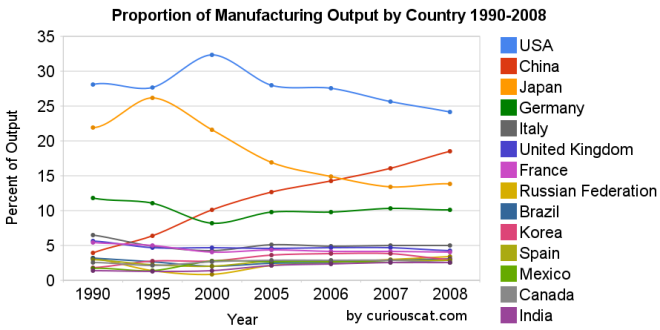
Chart showing the percentage output of top manufacturing countries from 1990-2008 by Curious Cat Management Blog, Creative Commons Attribution.

    The first chart shows the USA’s share of the manufacturing output, of the countries that manufactured over $185 billion in 2008, at 28.1% in 1990, 27.7% in 1995, 32% in 2000, 28% in 2005, 28% in 2006, 26% in 2007 and 24% in 2008. China’s share has grown from 4% in 1990, 6% in 1995, 10% in 2000, 13% in 2005, 14% in 2006, 16% in 2007 to 18% in 2008. Japan’s share has fallen from 22% in 1990 to 14% in 2008. The USA has about 4.5% of the world population, China about 20%. See Curious Cat Investment blog post” Data on the Largest Manufacturing Countries in 2008.

    Even with just this data, it is obvious the belief in a decades long steep decline in USA manufacturing is not in evidence. And, in fact the USA’s output has grown substantially over this period. It has just grown more slowly than that of China (as has every other country), and so while output in the USA has grown the percentage with China has shrunk. The percentage of manufacturing output by the USA (excluding output from China) was 29.3% in 1990 and 29.6% in 2008. The second chart shows manufacturing output over time.

    charts showing the top manufacturing countries output from 1990-2008
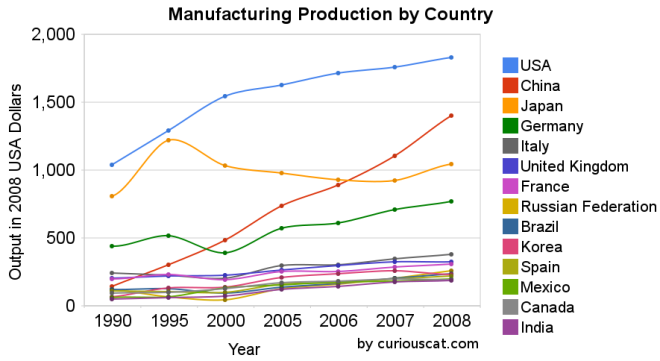
Chart showing the output of the top manufacturing countries from 1990-2008 by Curious Cat Management Blog, Creative Commons Attribution.

    The 2008 China data is not provided for manufacturing alone (the latest UN Data, for global manufacturing, in billions of current USA dollars). The percentage of manufacturing (to manufacturing, mining and utilities) was 78% for 2005-2007 (I used 78% of the manufacturing, mining and utilities figure provided in the 2008 data). There is a good chance this overstates China manufacturing output in 2008 (due to very high commodity prices in 2008).

    Hopefully these charts provide some evidence of what is really going on with global manufacturing and counteracts the hype, to some extent. Global economic data is not perfect. These figures are an attempt to capture the economic reality in the world but they are not a perfect proxy. This data is shown in 2008 USA dollars which is good in the sense that it shows all countries in the same light and we can compare the 1995 USA figure to 2005 without worrying about inflation. However foreign exchange fluctuations over time can show a country, for example, having a decline in manufacturing output in some year when in fact the output increased (just the decline against the USA dollar that year results in the data showing a decrease – which is accurate when measured in terms of USA dollars).

    If the dollar declines substantially between when the 2008 data was calculated and the 2009 data is calculated that will give result in the data showing a substantial increase in those countries that had a currency strengthen against the USA dollar. At this time the Chinese Renminbi has not strengthened while most other currencies have – the Chinese government is retaining a peg to a specific exchange rate.

    Korea (1.8% in 1990, 3% in 2008), Mexico (1.7% to 2.6%) and India (1.4% to 2.5%) were the only countries to increase their percentage of manufacturing output (other than China, of course, which grew from 3.9% to 18.5%).

    Related: posts on manufacturingGlobal Manufacturing Data by Country (2007)Global Manufacturing Employment Data – 1979 to 2007Top 10 Manufacturing Countries 2006Top 10 Manufacturing Countries 2005

  • Investors Sell TIPS as They Foresee Tame Inflation

    TIPS Drive Away Biggest Bond Bulls Seeing Inflation

    Treasury Inflation-Protected Securities are posting the biggest losses since Lehman Brothers Holdings Inc. collapsed in 2008 as investors say they’re too expensive when consumer prices are barely rising.

    TIPS pay interest on a principal amount that rises with consumer prices. Their face value is protected against deflation, because the principal can’t fall below par. The benchmark 1.375 10-year Treasury-Inflation Protected Security due January 2020 yields 1.45 percent.

    That’s 2.25 percentage points less than Treasuries of similar maturity that don’t provide protection from rising prices. The difference, known as the breakeven rate, reflects the pace of inflation investors expect over the life of the securities. The spread has fallen from the peak this year of 2.49 percentage points on Jan. 11.

    I believe that the risks of inflation are so low that TIPS are not a good way to invest some of your investment portfolio. At these low rates I agree TIPS are hardly a wonderful investment but I think it is worth sacrificing some yield to gain if inflation does return in a few years. But the argument for not buying TIPS is also sensible I think.

    Related: Bond Yields Show Dramatic Increase in Investor ConfidenceWho Will Buy All the USA’s Debt?Retirement Savings Allocation for 2010posts on bonds

  • Personal Savings Increased Again In December

    Once again the personal savings increases point to healthier economic choices being made by individuals.

    Personal saving was $534.2 billion in December, compared with $506.3 billion in November. Personal saving as a percentage of disposable personal income was 4.8%.

    Personal income increased $44.5 billion, or 0.4%, in December, according to the Bureau of Economic Analysis. Personal consumption expenditures increased $22.6 billion, or 0.2%, the 3rd straight month of increased spending.

    Related: Increasing USA Saving Rate is a Good SignSaving Spurts as Spending SlashedChanging Shopping Habits

  • Building an Emergency Fund

    Many people find personal financial planing boring. Building a cash safety net is an important part of your personal finances even though it isn’t exciting. I have written previously the very simple idea that you can just not buy what you can’t pay for. If you can’t pay for it this month, don’t buy it.

    But that leaves out one thing. Even if you do have the cash you should be building up a cash reserve before buying luxuries. The typical advice is to build up 6 months of expenses in cash (rent or mortgage, food bills, utilities, health care, etc.). Now actually building up to that level can take awhile and forgoing all non-mandatory expenses until you have that saved is not usually reasonable. But as part of your personal finances building up an cash reserve is important (even if it is boring). And I believe you really should aim at a higher level – say building to 1 year.

    A significant portion of downward spirals in personal finances are started when people have emergency expenses and have to borrow that money (since they don’t have cash reserves). And even worse when they start racking up huge fees for late payments, increased interest rates on outstanding debt, health care expenses if they fail to keep health care insurance…

    If you are over say 26 and don’t have a cash reserve yet saving for it should be part of your monthly budget. How quickly you build that up is a personal decision but I would say a 2% of the target amount (so if you are aiming for a cash reserve of $20,000 then $400/month). If you have next to nothing saved now start aiming at 6 months. As you get 3 months saved up start aiming at 9 months. As you get 6 months saved up start aiming at 1 year. And you have to also be saving for other needs – you shouldn’t raid your emergency fund savings for other things (a new car, a vacation…). This takes real discipline but it is much easier than the challenges our ancestors had to face of billions of people face financially today. So yes it is not easy, but really those that feel sorry for themselves need to realize they shouldn’t expect that they are so special the world owns them financial riches with little effort.

    Doing something is better than nothing so do what you can (even if it is less than 2% of you target). But realize that is one of the weaknesses in your personal finances and try to fix that as soon as possible.

    Very important personal financial allocations for you to put first include: current needs (food, car payment, rent/mortgage, utilities…), insurance, creating a cash reserve, retirement savings, saving for future purchases. Then there are luxuries and treats, such as: eating out, vacations, cable TV… Many people put current needs, luxuries and treats fist and then say they don’t have the ability to do what is responsible (check how rich you are – before making such claims yourself).

    Related: How to Protect Your Financial HealthSave Some of Each RaiseBuying Stuff to Feel PowerfulConsumer Debt Down Over $100 Billion So Far in 2009posts on basic personal finance matters

  • Jubak Looks at What Stocks to Hold Now

    Excellent post by James Jubak, Get your portfolio ready for the profitless global economic recovery

    the world hasn’t begun to address the problems of excess capital and the excess production capacity that it creates under current economic rules, the global economic recovery is going to turn out to be extraordinarily profitless in industry after industry as producers with excess capacity cut prices in an effort to buy market share.

    To avoid the trap of excess capacity killing even modest profits I think you have to look for sectors that have barriers that prevent excess capacity from driving down all prices as companies slit each other’s throats to acquire profitless market share.

    Cisco is the IBM of the Internet—companies can buy the company’s gear and know that it will talk to the rest of the gear in their network (because Cisco probably sold them a good part of that gear and because everybody makes sure their gear works with Cisco equipment.) Plus Cisco has used recent acquisitions to continue its transformation from a simple—but globally dominant–seller of routers into a company that builds unified digital communications systems.

    A second is Google (GOOG). Yes, Google stands a good chance of getting kicked out of China with its 1.3 billion potential Internet users (How old does a baby need to be to use the Gmail?). But no company is better positioned for the long-term trend toward distributed computing over the Internet than Google.

    Both Google and Cisco have been long term investments in my 12 stocks for 10 years portfolio. Jubak’s blog is excellent: the best investing blog I know of. He does trade quite a bit more than I do but his performance has been exceptional.

    Related: Jubak Looks at 5 Technology StocksWhy Investing is Safer Overseas10 Stocks for Income InvestorsTesco: Consistent Earnings Growth at Attractive Price

  • Initial 4th Quarter Data Show GDP Increased at 5.7% Annual Rate

    Real gross domestic product — the output of goods and services produced by labor and property located in the United States — increased at an annual rate of 5.7% in the fourth quarter of 2009, (that is, from the third quarter to the fourth quarter), according to the “advance” estimate released by the Bureau of Economic Analysis. In the third quarter, real GDP increased 2.2%.

    Real GDP decreased 2.4% in 2009 (that is, from the 2008 annual level to the 2009 annual level), in contrast to an increase of 0.4% in 2008. The price index for gross domestic purchases increased 0.1% in 2009, compared with an increase of 3.2% in 2008.

    The Bureau emphasized that the fourth-quarter advance estimate released today is based on source data that are incomplete or subject to further revision. The “second” estimate for the fourth quarter, based on more complete data, will be released on
    February 26, 2010.

    Related: China GDP up 8.7% in 20092nd Quarter 2009 USA GDP down 1%Japanese Economy Grew at 3.7% Annual Rate in 2nd Quarter 2009

    The increase in real GDP in the fourth quarter primarily reflected positive contributions from private inventory investment, exports, and personal consumption expenditures (PCE). Imports, which are a subtraction in the calculation of GDP, increased.

    The change in real private inventories added 3.39 percentage points to the fourth-quarter change in real GDP after adding 0.69 percentage point to the third-quarter change. Private businesses decreased inventories $33.5 billion in the fourth quarter, following decreases of $139.2 billion in the third quarter and $160.2 billion in the second. Real final sales of domestic product — GDP less change in private inventories — increased 2.2% in the fourth quarter, compared with an increase of 1.5% in the third.
    (more…)

  • Statistics on Entrepreneurship

    Some statistics from the Kauffman Foundation

    • From 1980–2005, firms less than five years old accounted for all net job growth in the United States.
    • More than half of the companies on the 2009 Fortune 500 list were launched during a recession or bear market, along with nearly half of the firms on the 2008 Inc. list of America’s fastest-growing companies.
    • Contrary to popularly held assumptions, the highest rate of entrepreneurial activity belongs to the 55–64 age group over the past decade. The 20–34 age bracket has the lowest.
    • Only 16 percent of the fastest-growing and most successful companies in the United States had venture investors.
    • More than a quarter of technology and engineering companies started in the United States from 1995 to 2005 had at least one key founder who was foreign-born.
    • Foreign nationals residing in the United States were named as inventors or co-inventors in 25.6 percent of international patent applications filed in the U.S. in 2006.

    Related: Y-Combinator’s Fresh Approach to EntrepreneurshipEntrepreneur ResultsKiva Fellows Blog: Nepalese Entrepreneur Success