Blog

  • Solar Energy Capacity by Country

    Solar energy capacity has been growing amazingly quickly the last few years. Part of the reason for this is the starting point was so low, making it easy to have large gains.

    Chart of global solar energy capacity by country 2009 to 2013
    Chart by Curious Cat Economics Blog using data from the US Department of Energy. Chart may be used with attribution as specified here.

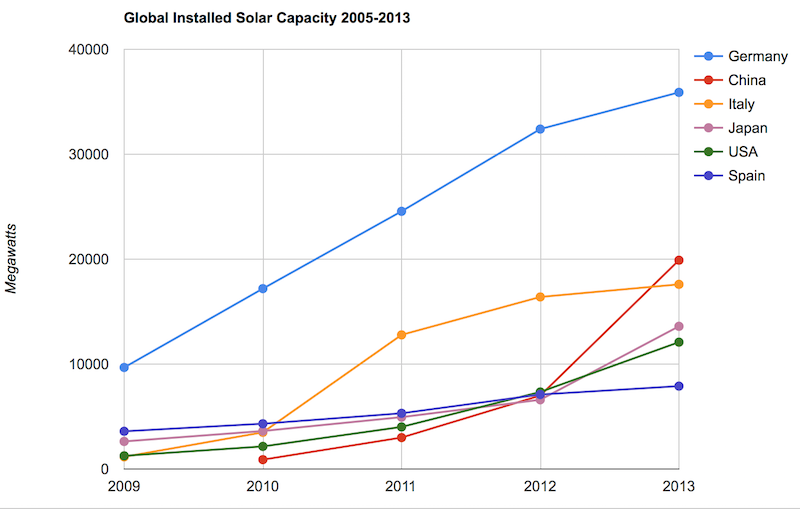
    As with so many macro economic measures China has made enormous investments in solar energy the last few years. China’s increase in 2013 was larger than the USA’s total capacity at the end of 2013. Since solar energy use on a large scale is still small investments are quickly ramping up. Europe was a few years ahead of others putting countries like Germany, Spain and Italy far in the lead. China, the USA and Japan have been investing huge amounts the last few years and will likely leave those other than Germany (which already has such a large capacity) far behind very shortly.

    In the USA, even after growing 60% in 2008, 53% in 2009, 71% in 2010, 86% in 2011, 83% in 2012 and 64% in 2013 solar energy capacity only totaled 1% of USA total electrical capacity. In 2013 hydropower was 6.8%, wind was 5.3% and biomass was 1.3%. The increase in solar capacity should continue to grow rapidly and is starting to make significant contributions to the macroeconomic energy picture.

    When you look at total electricity generation solar only represented .5% (compared to 6.6% for hydropower 4.1% for wind and 1.5% for biomass).

    USA data based on only solar capacity that is connected to the grid (and my guess would be that is the measure used in other countries too). Data is largely from that Department of energy report, with historical data for other countries pulled from previous editions.

    The US Energy Information Agency (USEIA) expects the USA to add (net) 9,841 MW of wind capacity; 4,318 MW of natural gas capacity and 2,235 MW of solar in 2015. In 2015 they also predict a net decline of 12,922 MW of coal capacity. They also share that nuclear plants and natural gas combined-cycle generators having utilization factors 3 to 5 times those of wind and solar generators, which means capacity measures are significantly different from actually produced electricity measures.

    The USEIA has predicted “global solar PV capacity seen rising from 98 GW in 2012 to 308 GW in 2018.” They predicted in 2018 China would have the most solar PV capacity followed by Germany, Japan and the USA.

    The Solar Energy Industries Association (USA) states that 5,000 MW of solar capacity was added in the USA in 2013 and 7,000 MW in 2014. They forecast 8,000 MW to be added in 2015 and 12,000 MW in 2016.

    Related: Solar Direct Investing BondsChart of Global Wind Energy Capacity by Country 2005 to 2013Leasing or Purchasing a Solar Energy System For Your HouseNuclear Power Generation by Country from 1985-2010Google Invests $168 million in Largest Solar Tower Power Project (2011)Molten Salt Solar Reactor Approved by California (2010)15 Photovoltaics Solar Power Innovations (2008)

  • USA Health Care Spending 2013: $2.9 trillion $9,255 per person and 17.4% of GDP

    USA health care spending increased at a faster rate than inflation in 2013, yet again; increasing 3.5%. Total health expenditures reached $2.9 trillion, 17.4% of the nation’s Gross Domestic Product (GDP) or $9,255 per person.

    While this remains bad news the rate at which heath care is increasingly costing those in the USA has been slower the last 5 years than it has been in past years. Basically the system is getting worse at a slower rate than we used to be, so while that isn’t great, it beats getting worse as quickly as we used to be. For the last 5 years the rate of increase has been between 3.6% and 4.1%.

    GDP has increased more than inflation. As the GDP grows the economy has more production for society to split. The split between the extremely wealthy and the rest of society has become much more weighted to the extremely wealthy (they have taken most of the gains to the overall economy in the last 20 years). Health care has a similar track record of devouring the gains made by the economy. This has resulted in health care spending soaring over the decades in an absolute basis and as a percentage of GDP.

    The slow down in how badly the health care system has performed in the USA has resulted in the share of GDP taken by the health care system finally stabilizing. Health care spending has remained near 17.4% since 2009. While hardly great news, this is much better news than we have had in the last 30 years from the USA health care system. The percentage of GDP taken by the USA health care system is double what other rich countries spend with no better health results.

    It is similar to if a team started as a championship team and then got worse every year and now they have finally stopped getting even worse. Granted they have become the worst team in the league but if, say, their record has now been 5-55 for 3 years in a row, they at least are not winning fewer game in each subsequent year anymore. But you can hardly think you are doing a great job when you are clearly the worst team each and every year.

    Obviously there is a need for much much more improvement in the USA health care system. Still stopping the growth in spending, as a percent of GDP, is a positive step toward drastically decreasing it to reach a level more in live with all other rich countries. Even this goal is only to have the USA reach a level of mediocrity. If you actually believe the USA can to better than mediocre that would imply a combination of drastic declines in spending (close to 50%) and drastic gains in outcomes. Decreasing spending by 50% would put the USA at essentially the definition of mediocre – middling result with average spending.

    Health Spending by Type of Service or Product

    • Hospital Care: Hospital spending increased 4.3% to $936.9 billion in 2013 compared to 5.7% growth in 2012. The lower growth in 2013 was influenced by growth in both prices and non-price factors (which include the use and intensity of services).
    • Physician and Clinical Services: Spending on physician and clinical services increased 3.8% in 2013 to $586.7 billion, from 4.5% growth in 2012. Slower price growth in 2013 was the main cause of the slowdown, as prices grew less than 0.1%, due in part to the sequester and a zero-percent payment update.
    • (more…)

  • Protecting Your Privacy and Security

    Provide easy, new access to credit facilitates sales. For that reason businesses want such easy access maintained. They don’t want people unable to buy just because they don’t have the money.

    Financial institutions make a great deal of money providing easy access to credit. They don’t want to slow it down. While they do want to reduce fraud, they are perfectly happy to allow a fair amount of fraud while they can still make a lot of money.

    What this means is the financial system has less incentive to eliminate identity theft than the people that have to clean up after it happens to them. There should be better ways to make identity theft much more difficult.

    At a lessor level it should also be more difficult to steal one credit card (which also creates a big hassle for us, in trying to clean things up after fraud occurs). I suggested a way to make credit cards more secure and useful. When Apple Pay was announced I learned they are doing basically what I suggested.

    Apple Pay doesn’t share information that can be used to steal your credit card. Apple Pay gives the retailer a 1 time use code for that purchase. It can’t be used, even if someone steals it to use your credit card for more purchases. I also believe Apple Pay doesn’t share other details with the retailer, though maybe I am wrong – I think it is just like you giving them cash (they don’t have your name, address, phone number, etc.).

    Much of the information businesses share in the USA is considered private in Europe and companies are not allowed to share that personal information. This makes identity theft and invasions of your privacy more difficult. I wish the USA would move more in that direction.

    If you have details stolen (a wallet…) you can put a note with credit agencies that results in them be less free to make it easy for financial institutions to give credit without sensible protections against misuse. But you can’t do this just as a matter of course. I believe we should have the ability to protect ourselves from the massive headache caused by businesses providing credit in our name. But we don’t have such protection now, because of the big money in keeping credit super easy (and thus fraud fairly easy).

    Having to clean up after identity you may well have to hire someone to help clean up your credit report. To do so, look for credit repair companies with good reviews and a good reputation.

    I would imagine choosing to put in extra protections against identity theft would mean we would have less easy access to credit. For example, I wish I could say you cannot provide a new credit under my name that isn’t using my address on file and without confirmation from my email. Also you are required to send an email, send a text message and send a postal letter, and update my credit agency file (in a way I can view) one week before credit is allowed.

    There should also be options such as you must get a positive reply from me. A citizen choosing to have better protection against identity theft would give up immediate access to credit. But I would happily do so. I believe millions of others would too. And given how many people are victims every years, millions or hundreds of thousand a new customers for such a service would likely result.

  • Looking at Real Estate in This Challenging Investing Climate

    I continue to believe the choices for investors are much more challenging than they normally are, as I have written about several times. Though maybe soon, this will just be the new normal (in which case investors won’t have the fairly easy choices they have had for much of the last 100 years).

    In previous posts I have discussed the value of real estate investments in this investing climate. Real estate is one way to cope with the challenges of extremely low yields today.

    There are many advantages to city property, in the right city. When I was looking at my first house I looked for something that would be easy to rent out. The most important factor to minimize vacancy is high demand. If there is high demand, the worst you should face is the need to lower your asking price.

    An additional consideration in buying condos (your only option in large urban centers like New York City, seen in my photo of the Empire State Building) are condo fees. Fees and taxes can make positive cash flow a challenge and they continue when the property is vacant thus creating more risk for the investor. Of course, in popular markets and good times rents are very attractive for owners and price increases can make them great investments.

    Empire State Building, New York City

    During downturns rental property that is not in high demand can be vacant no matter the price. And those properties with some, but not overwhelming, demand will face the need for dramatic rent decreases to minimize vacancy (and large declines if you need to sell). My purchase was 3 blocks from a metro stop (close in to Washington DC). All housing near metro stops in DC have high demand and that close in to the city has even higher demand.

    In over 10 years I have had maybe 2 months of vacancy – the first year I messed up; I was new to trying to rent places out and believed people were going to sign the lease because they said they would but then they backed out. I think I may have had 1 more month sometime, but maybe not, I can’t really remember.

    I have considered tourist property but have decided against it so far. The rental yield are higher but you have higher vacancy rates, which is manageable, but also much more property management issues to deal with. In order to cope with that you need to hire a property manager, very carefully. You need to carefully check their experience, reliability and competence.

    And even for residential real estate the hassles of dealing with the property management yourself may lead investors to use property managers. This cuts into the advantages of direct real estate investments and so if you are going to use property managers then looking at REITs has to be considered. I believe if you are sensible direct real estate investments would normally return more but the risks are significantly higher and the hassle is somewhat to significantly higher. Likely the decision on whether to use direct real estate investing is more about personal preference than just a decision on which option would be a better investment.

  • Interview with Investing Blogger John Hunter

    I was recently interviewed on equities.com, read the full interview – Financial Blogger Profile: John Hunter. Some quotes from the interview:

    What is your strategy when choosing stocks and investments?

    John Hunter: I look for good individual investments, but I also weigh my guesses about long term macroeconomic conditions in making investment commitments. I think there is much more risk to the drastic measures central banks have been making for the past few years than the market is factoring in. I think the poor job regulating risk in the financial system is also very risky at the macroeconomic level.

    I don’t have any real idea of what the chance of massive economic failure is, but I am much more worried today than I have been. Pretty much, my worry has remained the same over the last few years. We did avoid an immediate meltdown, though we still had plenty of economic pain. Yet, in my opinion, the risk has remained very high for the last few years, but people seem to think central banks can continue this extraordinary behavior without consequences; I see a great deal of risk in the economy.

    Three macro-economic factors make healthcare an appealing investment. First, the aging population should provide a booming market. Second, the huge increase in rich people globally that can afford very expensive medicine again provides an ever-growing market. Third, the broken healthcare system in the USA results in exceedingly high-priced medical care in a very large and rich market.

    I also close out the interview with some tips I have shared on this blog over the years

    If there was one piece of advice you’d like to impart to your readers, what would it be?
    John Hunter: I can’t pick one, but I can pick a few short pieces of advice:

    • Save 15%, or more, of your income and invest it wisely. If you want to buy more, then earn more, or save extra until you can pay for it with the extra savings.
    • Minimize costs on investments, use Vanguard or similar low fee funds. Buying individual stocks reduces even the costs of Vanguard. There are tradeoffs to diversity of your portfolio when buying individual stocks.
    • Pay attention to the overall risk of the portfolio, and even beyond that, your entire financial picture. For example, in the USA we have extra healthcare expense risk that is outside our portfolio risk, but is part of our entire financial picture. Building your portfolio with extra-portfolio risks in mind is wise. Don’t get fooled into thinking about the risks of investments taken individually, even though that is what you will continually be bombarded with.

    I think those that find this blog worthwhile will also enjoy the interview so I hope you read the full interview.

    Related: more interviews with John HunterInvestment Options Are Much Less Comforting Than Normal These DaysHow to Protect Your Financial Health

  • Historical Stock Returns

    One thing for investors consulting historical data to remember is we may have had fundamental changes in stock valuations over the decades (and I suspect they have). Just to over simplify the idea if lets say the market valued the average stock at a PE of 11 and everyone found stocks a wonderful investment. And so more and more people buy stocks and with everyone finding stocks wonderful they keep buying and after awhile the market is valuing the average stock at a PE of 14.

    Within the market there is tons of variation those things of course are not nearly that simple, but the idea I think holds. Well if you look back at historical data the returns will include the adjustment of going from a PE of 11 to a PE of 14. Now maybe the new few decades would adjust from PE of 14 to PE of 17 but maybe not. At some point that fundamental re-adjustment will stop.

    And therefore future returns would be expected to be lower than historically due to this one factor. Now maybe other factors will increase returns to compensate but if not the historical returns may well provide an overly optimistic view.

    And if there is a short term bubble that lets say pushes the PR to 16 while the “fair” long term value is 14, then there will be a negative impact on the returns going forward bringing the PE from 16 to 14. That isn’t necessarily a drop (though it could be) in stock prices, it could just be very slow increases as earning growth slowly pushes PE back to 14.

    Monument to the People's Heroes with the Shanghai skyline in the background
    Monument to the People’s Heroes with the Shanghai skyline in the background. See more photos by John Hunter

    Another thing to consider is another long term macro-economic factor may also be giving long term historical returns an extra boost. The type of economic growth from the end of World War I to 1973 (just to pick a specific time, there was a big economic slowdown after OPEC drastically increased the price of oil). While that period includes the great depression and World War II, which massively distorts figures, from the end of WW I through the 1960s Europe and the USA went through an amazing amount of economic growth.

    (more…)

  • Wealthiest 1% Continue Dramatic Gains Compared to Everyone Else

    This richest 1% continue to take advantage of economic conditions to amass more and more wealth at an astonishing rate. These conditions are perpetuated significantly by corrupt politicians that have been paid lots of cash by the rich to carry out their wishes.

    One thing people in rich countries forget is how many of them are in the 1% globally. The 1% isn’t just Bill Gates and Warren Buffett. 1% of the world’s population is about 72 million people (about 47 million adults). Owning $1 million in assets puts you in the top .7% of wealthy adults (Global Wealth Report 2013’ by Credit Suisse). That report has a cutoff of US $798,000 to make the global 1%. They sensibly only count adults in the population so wealth of $798,000 puts you in the top 1% for all adults.

    $100,000 puts you in the top 9% of wealthiest people on earth. Even $10,000 in net wealth puts you in the top 30% of wealthiest people. So while you think about how unfair it is that the system is rigged to support the top .01% of wealthy people also remember it is rigged to support more than 50% of the people reading this blog (the global 1%).

    I do agree we should move away from electing corrupt politicians (which is the vast majority of them in DC today) and allowing them to continue perverting the economic system to favor those giving them lots of cash. Those perversions go far beyond the most obnoxious favoring of too-big-to-fail banking executives and in many ways extend to policies the USA forces on vassal states (UK, Canada, Australia, France, Germany, Japan…) (such as those favoring the copyright cartel, etc.).

    Those actions to favor the very richest by the USA government (including significantly in the foreign policy – largely economic policy – those large donor demand for their cash) benefit the global 1% that are located in the USA. This corruption sadly overlays some very good economic foundations in the USA that allowed it to build on the advantages after World War II and become the economic power it is. The corrupt political system aids the richest but also damages the USA economy. Likely it damages other economies more and so even this ends up benefiting the 38% of the global .7% that live in the USA. But we would be better off if the corrupt political practices could be reduced and the economy could power economic gains to the entire economy not siphon off so many of those benefits to those coopting the political process.

    The USA is home to 38% of top .7% globally (over $1,000,000 in net assets).

    country % of top .7% richest % of global population
    USA 38.3% 4.5%
    Japan 8.6% 1.8%
    France 7.5% .9%
    UK 6.1% .9%
    Germany 5.9% 1.1%
    other interesting countries
    China 3.4% 19.2%
    Korea 1% .7%
    Brazil .6% 2.8%
    India .5% 17.5
    Indonesia .3% 3.5%

    Oxfam published a report on these problems that has some very good information: Political capture and economic inequality

    (more…)

  • Spread Betting and Contracts for Difference

    I am largely a fundamental investor with the long term time horizon that fits such investing. I however am also a believer in using some more speculative investing for a portion of a portfolio if it fits the risk profile of an investor.

    If you are not comfortable with the risk of an investment most of the time you shouldn’t make that investment. There is a bit of a conflict, for example, where an investor is scared of any loss from say an investment in a stock market index and trying to save for retirement on a median level income. It is nearly impossible to save for retirement without investing in stocks if you are not already rich, so as with most investment advice there is a bit of difficulty at the extremes but in general investors shouldn’t take on risk they are not comfortable with.

    For experienced investors with a high level of financial literacy more speculative options can have a useful role in a portfolio. Though you should realize most people fail with speculation, so you have to be realistic about your prospects. I have used speculative investments including naked short selling, leverage (margin) and options.

    Spread betting is another speculative strategy that can play a part in an investment portfolio. Spread betting is not allowed in the USA (with our highly regulated personal investing environment but is available in most other countries). They are somewhat similar to binary options (which are allowed in the USA) and to futures contracts (they are not the same, just those are comparable to get some idea of how you would use them in a portfolio).

    Spread betting really is a bet on what will happen. You don’t buy a financial instrument. You place a bet with a company and if the prices move for you and you close the position with a gain they pay out a gain to you and if you close out the position with a loss your capital held with them is reduced by your loss amount.

    Since the price to control a position is much less than the notional position size there is a large degree of leverage which increases the affect of gains and loses. Since positions can move against you and must be settled if the loss exceed your deposit with the company you are trading with having a substantial cash cushion is the way I would use such a speculative account. If I decided I could afford to risk losing $5,000 I would deposit that amount.

    My purchases would about 10% of the capital in the account (so $500 at first). If that is leveraged at 20 to 1 (just requiring 5% down on margin), that would make my effective leverage just 2 to 1. But if I added other positions that would increase my leverage, say 2 more purchases and my leverage would be 6 to 1.

    The way I have managed the speculative portion of my portfolio is to fund it and then pull off part of the gains to my long term portfolio and retain part of the gains to build my speculative account. It isn’t really quite that clear as I have different level of speculation in my portfolio. Options are speculative but have a limit of 100% loss. Selling stocks short (naked shorting) is speculative but has theoretically unlimited losses. Using margin on regular stocks has the potential to lose more than you have invested though most of the time you should be stopped out before the losses are too much beyond your entire account value.

    So I don’t really have a clear cut speculative portfolio but I roughly follow that procedure. I have added to the speculative portion when I have had very large gains in a particular portion of my main portfolio.

    Another factor with spread betting, shorting and options is that they can actually be used to reduce the risk of your overall portfolio using certain strategies. If you believe there is a risk for a market downturn but don’t want to sell any of your stock holdings you can use spread betting to create a position that will gain if the market declines. That gain then will offset the likely loss on your stock positions thus reducing you risk in a market decline.

    Of course, if you do that and the market moves up you will create a loss on you spread betting position that offsets your gains on your stock positions. You could also bet against specific stocks that you think will decline more in a market decline and seek to increase your return of course that has risks (including the market declining along with your stocks but that stocks you bet against could move against you anyway). I have used this strategy with selling stocks short occasionally.

    An additional risk to consider with spread betting is you need to find a company you trust to be around to pay off your gains. You would want to examine the safety of your funds and that (in the UK) the account is covered by the Financial Conduct Authority (FCA) and complies with the FCA’s Client Assets provisions (and in other countries they have similar coverage). To be safe you should consider whether holding more than the covered amount is wise in your account. The last 10 years have provided examples of the riskiness of financial companies going out of business; that your funds wouldn’t be accessible is a risk that must be considered.

    Related: Shorting Using Inverse FundsBooks on Trading and Speculating in Financial MarketsSelling Covered Call Options

  • 20 Most Popular Posts on Our Blog in 2014

    Most popular posts on the Curious Cat Investing and Economics blog in 2014 (by page views).

    Related: 20 Most Popular Post on Curious Cat Science and Engineering Blog in 201410 Most Popular Posts on the Curious Cat Management Blog in 2014Most Popular Posts on the Curious Cat Management Comments Blog

  • More Than Half of Those in the USA are at Risk of Not Saving Enough for Retirement

    The Center for Retirement Research at Boston College is a tremendous resource for those planning for, or in, retirement. The center created the National Retirement Risk Index (NRRI) to capture a macroeconomic level measure of how those in the USA are progressing toward retirement.

    Based on the Federal Reserve’s 2013 Survey of Consumer Finances the Center updated the NRRI results (the entire article is a very good read).

    The NRRI shows that, as of 2013, more than half of today’s households will not have enough retirement income to maintain their pre-retirement standard of living, even if they work to age 65 – which is above the current average retirement age – and annuitize all their financial assets, including the receipts from a reverse mortgage on their homes. The NRRI clearly indicates that many Americans need to save more and/or work longer.
    chart of USA retirement risk index from 1983 to 2013
    from the NRRI report.

    The lower the risk number in the chart the better, so things have not been going well since the 1990s for those in the USA saving for retirement.

    As the report discusses their are significant issues with retirement planning that defy easy prediction; this makes things even more challenging for those saving for retirement. The report discusses the difficulty placed on retirees by the Fed’s extremely low interest rate policy (a policy that provides billions each year to too-big-too-fail banks – hardly the reward that should be provided for bringing the world to economic calamity but never-the-less that transfer of wealth from retirees to too-big-to-fail banks is the policy the Fed has chosen).

    That exacerbates the problems of too little savings during the working career for those in the USA. The continued evidence is that those in the USA continue to spend too much today and save too little. Also you have to expect the Fed and politicians will continue to make policy that favors their friends at too-big-fail banks and hedge funds and the like. You can’t expect them to behave differently than they have been the last 50 years. That means the likely actions by the government to take from median income people to aid the richest 1% (such as bailing out the bankers with super low interest rate policies and continue to subsidize losses and privatize their winning bets) will continue. You need to have extra savings to support those policies. Of course we could change to do things differently but there is no realistic evidence of any move to do so. Retirement planning needs to be based on evidence, not hopes about how things should be.

    Related: How Much of Current Income to Save for RetirementSave What You Can, Increase Savings as You Can Do SoDon’t Expect to Spend Over 4% of Your Retirement Investment Assets AnnuallyRetirement Planning: Looking at Assets (2012)How Much Will I Need to Save for Retirement? (2009)