Tag: Germany

  • Manufacturing Output as a Percent of GDP by Country

    In previous posts I have shown data for global manufacturing output by country. One of the things those posts have showed is that manufacturing output in China is growing tremendously, but it is also growing in the United States. The chart below shows manufacturing production by country as a percent of GDP. China dominates again, with over 30% of the GDP from manufacturing.

    chart of manufacturing output as percent of gdp by country 1980-2008

    Chart showing manufacturing output, as percent of GDP, by country was created by the Curious Cat Economics Blog based on UN data* (based on current USA dollars). You may use the chart with attribution.

    For the 14 biggest manufacturing countries in 2008, the overall manufacturing GDP percentage was 23.7% of GDP in 1980 and dropped to 17% in 2008. I left India (15% in 1980, 15% in 2008), Mexico (20%, 18%), Canada (17%, 13%), Spain (25%, 14%) and Russia (21% in 1990 [it was part of USSR in 1980], 15%) off the chart.

    Over the last few decades Korea, and to some extent China, are the only countries that have increased the percent of GDP from manufacturing. China has not only grown manufacturing activity tremendously but also other areas of the economy (construction, mining, information technology). The countries with the largest manufacturing portions of their economies in 2008 were: China 32%, South Korea 25%, Japan and Germany at 21%. The next highest is Mexico at 18% which declined slightly over the last 15 years (with NAFTA in place). Globally, while manufacturing has grown, other areas of economic activity have been growing faster than manufacturing.

    The manufacturing share of the USA economy dropped from 21% in 1980 to 18% in 1990, 16% in 2000 and 13% in 2008. Still as previous posts show the USA manufacturing output has grown substantially: over 300% since 1980, and 175% since 1990. The proportion of manufacturing output by the USA (for the top 14 manufacturers) has declined from 31% in 1980, 28% in 1990, 32% in 2000 to 24% in 2008. The proportion of USA manufacturing has declined from 33% in 1980, 29% in 1990, 36% in 2000 to 30% in 2008. While manufacturing output has grown in the USA it has done so more slowly than the economy overall.

    Related: The Relative Economic Position of the USA is Likely to DeclineManufacturing Data, Accuracy QuestionsTop 12 Manufacturing Countries in 2007Manufacturing Employment Data: 1979 to 2007USA Manufacturing Output Continues to Increase (over the long term)

    * I made edits to the 1980 Brazil manufacturing data and 1980, 1985 and 2008 China manufacturing data because the UN data only showed manufacturing data combined with mining and utility data. And I am using older UN data that had manufacturing separated from mining and utility figures for China in the other years.

  • Private Foreign Banking Deposits by Country

    According to a new report on Privately Held, Non-Resident Deposits in Secrecy Jurisdictions the United States is the country with the largest amount of private, non-resident, deposits. Cayman Islands takes second, upholding its commonly held reputation as a tax haven often used to avoid paying taxes own by wealthy people. Switzerland comes in 9th.

    The countries with the most private, foreign deposits in billion of $US.

    Country June 2008 June 2009
    1 United States $2,899 $2,183
    2 Cayman Islands $1,515 $1,550
    3 United Kingdom $1,796 $1,534
    4 Luxembourg 588 435
    5 Germany 494 426
    6 Jersey 544 393
    7 Netherlands 413 316
    8 Ireland 273 276
    9 Switzerland 289 274
    10 Hong Kong 325 268

    Since 2001 deposits in the Cayman Islands have more than tripled, while those in the UK have close to tripled and in the USA they have a bit more than doubled.

    • Total Current total deposits by non-residents in offshore centers and secrecy jurisdictions are just under US$10 trillion;
    • The United States, the United Kingdom, and the Cayman Islands top the list of jurisdictions, with the United States out in front with more than US$2 trillion in non-resident, privately held deposits in the most recent quarter for which data are available (June 2009);
    • Contrary to expectations of perceived favorability for deposits, Asia accounts for only 6 percent of worldwide offshore deposits, although Hong Kong is the tenth most popular secrecy jurisdiction by deposits in this report;
    • The rate of growth of offshore deposits in secrecy jurisdictions has expanded at an average of 9 percent per annum since the early 1990s, significantly outpacing the rise of world wealth in the last decade. The gap between these two growth rates may be attributed to increases in illicit financial flows from developing countries and tax evasion by residents of developed countries.

    The report is an interesting read and provides some background on the banking practices often used in concert with wealthy people avoiding paying taxes. As you may we recall we noted that rich USA tax evaders tried to sue to hide their illegal activities from the Department of Justice. As far as I know those rich thieves have not been put in jail. I guess stealing tens and hundreds of thousands of dollars from the United States of America, by rich people, is not seen as important (either that or brides work to make sure the way rich people steal isn’t punished) say compared to some teenager stealing from a store.

    Related: Government Debt Globally as Percentage of GDP 1990-2008USA, China and Japan Lead Manufacturing Output in 2008Oil Consumption by Country in 2007

    (more…)

  • Taxes per Person by Country

    From Greg Mankiw’s Blog

    Taxes/GDP x GDP/Person = Taxes/Person

    France .461 x 33,744 = $15,556

    Germany .406 x 34,219 = $13,893

    UK .390 x 35,165 = $13,714

    US .282 x 46,443 = $13,097

    Canada .334 x 38,290 = $12,789

    Italy .426 x 29,290 = $12,478

    Spain .373 x 29,527 = $11,014

    Japan .274 x 32,817 = $8,992

    The USA is the 2nd lowest for percent of GDP taxes 28.2% v 27.4% for Japan. But in taxes per person toward the middle of the pack. France which has 46% taxes/GDP totals $15,556 in tax per person compared to $13,097 for the USA.

    Related: Government Debt as Percentage of GDP 1990-2008 – USA, Japan, Germany…Oil Consumption by Country in 2007USA, China and Japan Lead Manufacturing Output in 2008Bigger Impact: 15 to 18 mpg or 50 to 100 mpg?

  • Government Debt as Percentage of GDP 1990-2008 – USA, Japan, Germany…

    Recently Greece and the huge USA federal deficits have highlighted the problem of excessive government debt. The above chart shows gross government debt by country from the IMF.

    Korea has essentially no gross government debt (under 2% of GDP for the entire period). At the other end of the spectrum Japan has seen gross government debt rise to 197% (Japan’s 2008 figure is an IMF estimate). The IMF did not have data for Greece (which would likely look very bad) or China (which I would think would be very low – maybe even negative – the government having more assets than debt).

    The USA debt stood at 64% in 1990, 71% in 1995, 55% in 2000, 61% in 2005 and 70% in 2008. Most countries are expected to see significant increases in 2009. The IMF sees the USA going to 85% in 2009 and 100% in 2012. They see Germany at 79% in 2009 and 90% in 2012. They See the UK at 69% in 2009 and 94% in 2012. They see Japan at 237% in 2012.

    Government debt as percentage GDP 1990-2008The chart shows gross government debt as percentage GDP 1990-2008. By Curious Cat Investing and Economics Blog, Creative Commons Attribution.

    ___________________________

    The data here is very similar to the OECD data I provided earlier, Government Debt Compared to GDP 1990 to 2007, though with some notable differences. In the OECD data was still in the best shape, but is seen as having 29% debt to GDP in 2007. The IMF data attempts to avoid issues where some countries have debt of non-federal governments that are hidden when looking just at federal government debt.

    Data source: IMF data (for some countries the data is also from that site but at different urls).

    Related: The Long-Term USA Federal Budget OutlookUSA, China and Japan Lead Manufacturing Output in 2008Oil Consumption by Country in 2007Saving Spurts as Spending Slashed

  • USA, China and Japan Lead Manufacturing Output in 2008

    Once again the USA was the leading country in manufacturing in 2008. And once again China grew their manufacturing output amazingly. In a change with recent trends Japan grew output significantly. Of course, the 2009 data is going to show the impact of a very severe worldwide recession.

    Chart showing percent of output by top manufacturing countries from 1990 to 2008
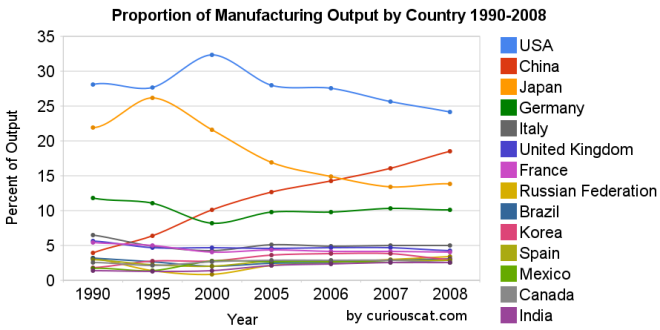
Chart showing the percentage output of top manufacturing countries from 1990-2008 by Curious Cat Management Blog, Creative Commons Attribution.

    The first chart shows the USA’s share of the manufacturing output, of the countries that manufactured over $185 billion in 2008, at 28.1% in 1990, 27.7% in 1995, 32% in 2000, 28% in 2005, 28% in 2006, 26% in 2007 and 24% in 2008. China’s share has grown from 4% in 1990, 6% in 1995, 10% in 2000, 13% in 2005, 14% in 2006, 16% in 2007 to 18% in 2008. Japan’s share has fallen from 22% in 1990 to 14% in 2008. The USA has about 4.5% of the world population, China about 20%. See Curious Cat Investment blog post” Data on the Largest Manufacturing Countries in 2008.

    Even with just this data, it is obvious the belief in a decades long steep decline in USA manufacturing is not in evidence. And, in fact the USA’s output has grown substantially over this period. It has just grown more slowly than that of China (as has every other country), and so while output in the USA has grown the percentage with China has shrunk. The percentage of manufacturing output by the USA (excluding output from China) was 29.3% in 1990 and 29.6% in 2008. The second chart shows manufacturing output over time.

    charts showing the top manufacturing countries output from 1990-2008
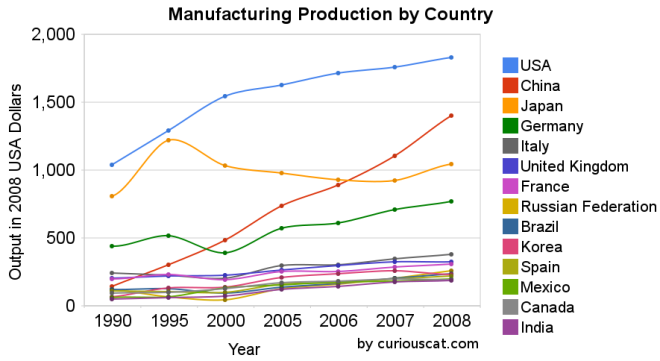
Chart showing the output of the top manufacturing countries from 1990-2008 by Curious Cat Management Blog, Creative Commons Attribution.

    The 2008 China data is not provided for manufacturing alone (the latest UN Data, for global manufacturing, in billions of current USA dollars). The percentage of manufacturing (to manufacturing, mining and utilities) was 78% for 2005-2007 (I used 78% of the manufacturing, mining and utilities figure provided in the 2008 data). There is a good chance this overstates China manufacturing output in 2008 (due to very high commodity prices in 2008).

    Hopefully these charts provide some evidence of what is really going on with global manufacturing and counteracts the hype, to some extent. Global economic data is not perfect. These figures are an attempt to capture the economic reality in the world but they are not a perfect proxy. This data is shown in 2008 USA dollars which is good in the sense that it shows all countries in the same light and we can compare the 1995 USA figure to 2005 without worrying about inflation. However foreign exchange fluctuations over time can show a country, for example, having a decline in manufacturing output in some year when in fact the output increased (just the decline against the USA dollar that year results in the data showing a decrease – which is accurate when measured in terms of USA dollars).

    If the dollar declines substantially between when the 2008 data was calculated and the 2009 data is calculated that will give result in the data showing a substantial increase in those countries that had a currency strengthen against the USA dollar. At this time the Chinese Renminbi has not strengthened while most other currencies have – the Chinese government is retaining a peg to a specific exchange rate.

    Korea (1.8% in 1990, 3% in 2008), Mexico (1.7% to 2.6%) and India (1.4% to 2.5%) were the only countries to increase their percentage of manufacturing output (other than China, of course, which grew from 3.9% to 18.5%).

    Related: posts on manufacturingGlobal Manufacturing Data by Country (2007)Global Manufacturing Employment Data – 1979 to 2007Top 10 Manufacturing Countries 2006Top 10 Manufacturing Countries 2005

  • Data on the Largest Manufacturing Countries in 2008

    Manufacturing is an powerful driver of economic wealth. For years I have been providing data to counter the contention that the manufacturing base of the USA is gone and the little bit left was shrinking. The latest data again shows the USA is the largest manufacturer, and manufacturing in the USA continues to grow. It is true global manufacturing has begun to grow more rapidly than USA manufacturing in the last few years. I doubt many suspect that the USA’s share of manufacturing stayed stable from 1990 to 1995 then grew to 2000 took until 2006 to return to the 1990-1995 levels and then has declined in 2007 and 2008 a bit below the 1990 level and during that entire time was growing (even in 2007 and 2008).

    The USA’s share of the manufacturing output, of the countries that manufactured over $185 billion in 2008, 28% in 1990, 28% in 1995, 32% in 2000, 28% in 2005, 28% in 2006, 26% in 2007 and 24% in 2008. China’s share has grown from 4% in 1990, 6% in 1995, 10% in 2000, 13% in 2005, 14% in 2006, 16% in 2007 to 18% in 2008. Japan’s share has fallen from 22% in 1990 to 14% in 2008 (after increasing to 26% in 1995 then steadily falling). The USA has about 4.5% of the world population, China about 20%.

    Based on the latest UN Data, for global manufacturing, in billions of current US dollars:

    Country 1990 1995 2000 2005 2006 2007 2008
    USA 1,041 1,289 1,543 1,624 1,712 1,756 1,831
    China 145 300 484 734* 891* 1,106* 1,399**
    Japan 810 1,219 1,034 979 927 923 1,045
    Germany 438 517 392 571 608 711 767
    Italy 240 226 206 295 302 345 381
    United Kingdom 206 218 226 264 295 323 323
    France 200 233 190 255 255 287 306
    Russian Federation 120 64 45 124 157 206 256
    Brazil 120 125 96 137 163 201 237
    Korea 66 131 136 211 234 260 231
    Spain 112 104 98 160 170 196 222
    Mexico 62 67 133 154 175 182 197
    Canada 92 100 129 168 182 197 195
    India 51 61 69 122 141 177 188

    * I am using the data from last year that separated the manufacturing data (this year the data does not provide separate manufacturing data for China) instead of that shown in the most recent data (which doesn’t separate manufacturing)
    ** The China data is not provided for manufacturing alone. The percentage of manufacturing (to manufacturing, mining and utilities) was 78% for 2005-2007 (I used 78% of the manufacturing, mining and utilities figure provided in the 2008 data).

    I hope to write a series of posts examining global manufacturing data including looking at manufacturing data specifically (excluding mining and utility data).
    (more…)

  • Government Debt Compared to GDP 1990-2007

    Government debt as percent of GDP 1990-2007Chart showing government debt as a percentage of GDP by Curious Cat Investing Economics Blog, Creative Commons Attribution, data from OECD, Sept 2009.
                    

    For 2007 most countries slightly decreased their government debt to GDP ratio – as economic growth exceeded debt growth. The OECD is made up of countries in Europe and the USA, Japan, Korea, Australia, New Zealand and Canada. The overall OECD debt to GDP ratio decreased from 77% in 2005 to 75% in 2007. The USA moved in the opposite direction increasing from 62% to 63%: still remaining far below the OECD total. Most likely 2008, 2009 and 2010 will see both the USA and other OECD national dramatically increase the debt burden.

    Compared to the OECD countries the USA is actually better than average. The chart shows the percentage of GDP that government debt represents for various countries. The USA ended 2007 at 63% while the overall OECD total is 75%. In 1990 the USA was at 63% and the OECD was at 57%. Japan is the line way at the top with a 2007 total of 171% (that is a big problem for them). Korea is in the best shape at just a 29% total in 2007 but that is an increase from just 8% in 1990.

    Related: Government Debt as a Percentage of GDP Through 2006Oil Consumption by Country in 2007Federal Deficit To Double This YearPoliticians Again Raising Taxes On Your ChildrenTrue Level of USA Federal DeficitTop 12 Manufacturing Countries in 2007
    (more…)