Solar energy capacity has been growing amazingly quickly the last few years. Part of the reason for this is the starting point was so low, making it easy to have large gains.
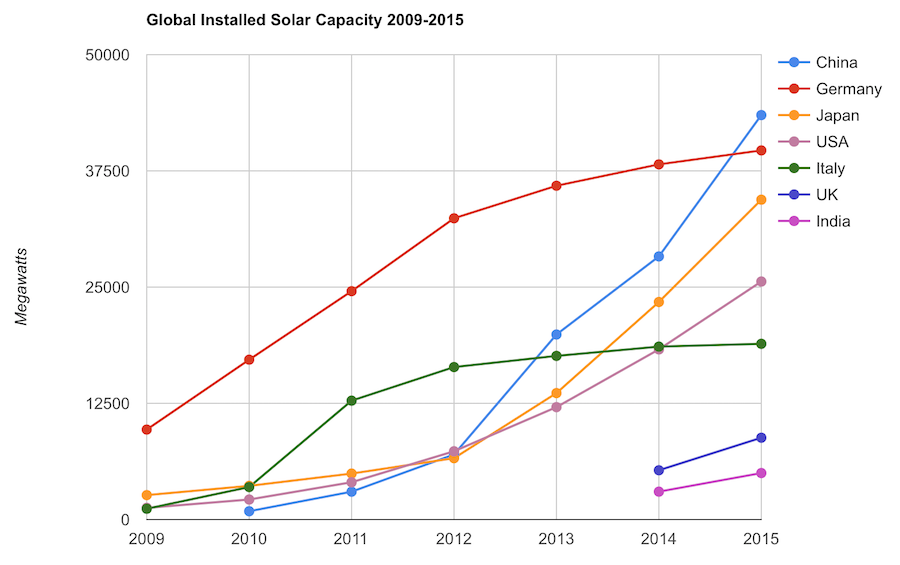
The 2014 and 2015 data on this chart is from IAE report for total installed photovoltaic (PV) solar capacity. See previous post on chart of Solar Energy Capacity by Country from 2009 to 2013. Different data sources for different year (and/or countries in the same year) is not ideal but for the purposes of this data in this post is sufficient.
Installed PV capacity is even more questionable that much other economic data. Economic data are always approximations of reality but with PV you have additional questions. The same plant located outside London or Rome have different capability to produce (and there are many factors that contribute not just the most obvious such as how much sun shines in a particular geography). Installed PV data is based on the capability of the equipment regardless of the solar potential of the location.
So even with the same investment it is likely Italy gets more production than Germany. The IAE report attempted to determine what was the likely ability of the solar PV capacity to produce for each country as a percentage of total electricity needs. They estimate Italy has the largest percentage of electricity needs capable of being produced by installed PV systems at 8%, with Greece at 7.4% and Germany at 7.1%. Japan is ranked 5th at just under 4%, UK is 12th at 2.5%, China is 22nd at 1%, India 24th and the USA 25th at close to .9%. They estimate the total global percentage at 1.3%.
These figures also show the huge power needs of China and the USA. Even with huge investments in Solar they us so much electricity that it is slow to make large gains in the percentage of total power generated by solar.
In the USA in 2013 solar energy capacity was under 1% USA total electrical capacity. In 2013 hydropower was 6.8%, wind was 5.3% and biomass was 1.3%. The increase in solar capacity should continue to grow rapidly and is making significant contributions to the macroeconomic energy picture (even if it doesn’t appear dramatic).
Related: Chart of Global Wind Energy Capacity by Country from 2005 to 2015 – Leasing or Purchasing a Solar Energy System For Your House – Nuclear Power Generation by Country from 1985-2010 – Manufacturing Output by Country 1999-2011: China, USA, Japan, Germany
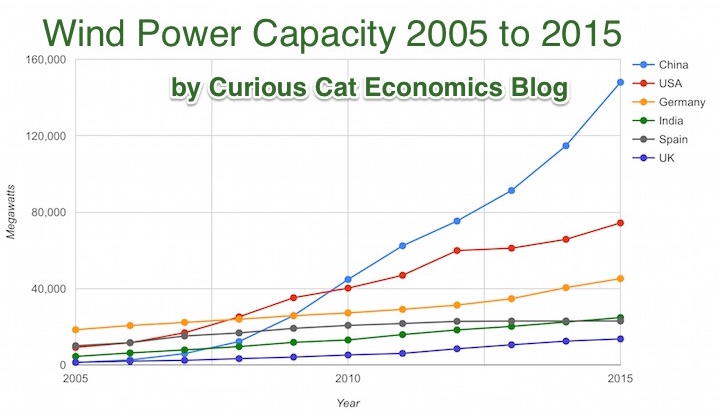
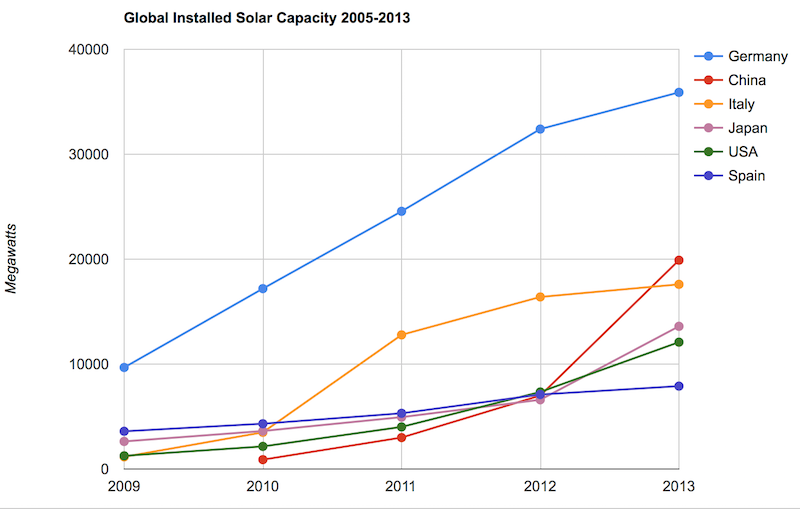
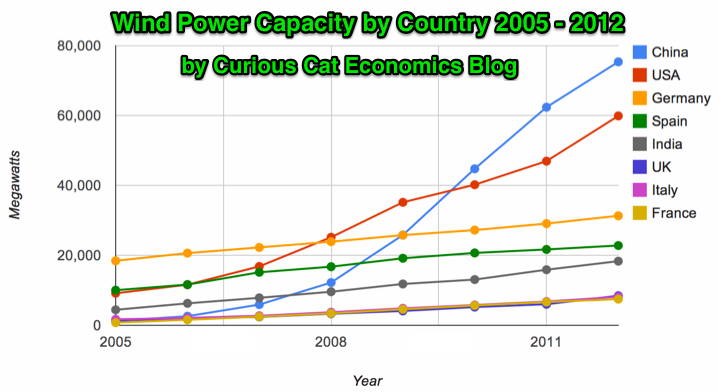
 Chart by Curious Cat Economics Blog using