Category: Economics

  • Paying Back Direct Cash from Taxpayers Does not Excuse Bank Misdeeds

    Many people are ignoring huge costs (to the economy) and benefits (to those financial companies that ruined so many people’s lives and severely damaged the economy. Paying back money the government paid you is not that same as being innocent. While several of the too big to fail banks have paid back the direct cash they were given that is not an indication they are now off the hook for their disastrous behavior.

    First we know that much of the money “sent to AIG” just went directly to Goldman Sachs and others. Those big banks had taken risks and the only way those risks paid off was with billions from taxpayers. Without that they would have been bankrupt. And then when they paid the money they received directly they still haven’t paid back the billions they got from taxpayers (via AIG). And this money was paid back at 100 cents on the dollar though those instruments were trading for much less in the market (the government certainly would have found a less costly solution but for ignorance or a desire to reward their former company and friends at Goldman Sachs.

    Second, rates have been kept artificially low, to among other things, allow the big banks to make tens of billions (and costing savers tens of billions). Those savers have not been reimbursed for the losses caused by the big banks.

    And third if I gamble with money from my company and win my bet on the Super Bowl and then put the money back, I am still not innocent. Just because many of the big banks have paid back the money they were given directly by taxpayers does not mean they didn’t get huge benefits from the government. Pretending they are not bad guys because after ruining the economy, costing millions of people their jobs and savings, getting many benefits from the government, they then pay back the direct cash payments is not accurate.

    Response to: The New Bank Tax

    Related: Elizabeth Warren Webcast On Failure to Fix the SystemThe Best Way to Rob a Bank is as An Executive at OneFailure to Regulate Financial Markets Leads to Predictable ConsequencesJim Rogers on the Financial Market MessCongress Eases Bank Laws (1999)

  • Curious Cat Investing and Economics Carnival #7

    Welcome to the Curious Cat Investing and Economics Carnival: we highlight interesting recent personal finance, investing and economics blog posts.

    • The 4% rule and other fallacies of retirement planning – “I might try a 5% withdrawal rate, which according to the Trinity study, would give me an 80% chance of not outliving my money. As time goes on, I’ll adjust up or down depending on what life and the market throws at me.”
    • The lesson of the Greek crisis: Every government cheats and no one wants to know by James Jubak – “The IMF projects that U.S. net debt as a percentage of GDP will be 66.8% in 2010, more than twice that for Canada, and gross debt will be 93.6% of GDP, still almost 14 percentage points above Canada’s.”
    • Renting 101: What You Should Know Before You Sign by Austin Morgan – “Renter’s insurance helps protect the items in your apartment in case of theft or damage. The renter’s insurance will also cover you in case a visitor in your apartment gets injured or their items get damaged.”
    • In the USA 43% Have Less Than $10,000 in Retirement Savings by John Hunter – “if you plan ahead you have a long time for compounding to work in your favor. Unfortunately most people continue to fail to make even the most minimal efforts to save for retirement”
    • The US Has A Spending Problem, China Has A Savings Problem – “Back in 2005 the savings rate in the US dropped to below 1%. That’s sad considering up until the mid 80s we were always above 5% and crested 10% a few times… Our savings rate is currently just under 5%… The savings rate in China is something like 30%; and this number has grown in recent years, “
    • When will the Fed raise interest rates? by Olivier Coibion and Yuriy Gorodnichenko – “given current information and barring political or populist pressures, one can reasonably expect the Federal Reserve to start raising interest rates toward the end of this year in its attempt to balance the risks of higher inflation against prolonging the current economic downturn.”
    • (more…)

  • Government Debt as Percentage of GDP 1990-2008 – USA, Japan, Germany…

    Recently Greece and the huge USA federal deficits have highlighted the problem of excessive government debt. The above chart shows gross government debt by country from the IMF.

    Korea has essentially no gross government debt (under 2% of GDP for the entire period). At the other end of the spectrum Japan has seen gross government debt rise to 197% (Japan’s 2008 figure is an IMF estimate). The IMF did not have data for Greece (which would likely look very bad) or China (which I would think would be very low – maybe even negative – the government having more assets than debt).

    The USA debt stood at 64% in 1990, 71% in 1995, 55% in 2000, 61% in 2005 and 70% in 2008. Most countries are expected to see significant increases in 2009. The IMF sees the USA going to 85% in 2009 and 100% in 2012. They see Germany at 79% in 2009 and 90% in 2012. They See the UK at 69% in 2009 and 94% in 2012. They see Japan at 237% in 2012.

    Government debt as percentage GDP 1990-2008The chart shows gross government debt as percentage GDP 1990-2008. By Curious Cat Investing and Economics Blog, Creative Commons Attribution.

    ___________________________

    The data here is very similar to the OECD data I provided earlier, Government Debt Compared to GDP 1990 to 2007, though with some notable differences. In the OECD data was still in the best shape, but is seen as having 29% debt to GDP in 2007. The IMF data attempts to avoid issues where some countries have debt of non-federal governments that are hidden when looking just at federal government debt.

    Data source: IMF data (for some countries the data is also from that site but at different urls).

    Related: The Long-Term USA Federal Budget OutlookUSA, China and Japan Lead Manufacturing Output in 2008Oil Consumption by Country in 2007Saving Spurts as Spending Slashed

  • “What the Financial Sector Did to Us”

    Nobel Prize winning economist Joseph Stiglitz explores the current financial system and the damage done to the economy due to that system. As he states in the video the credit crisis is not something that happened to the financial institutions. The credit crisis caused recession is something the financial sector did to us.

    He covers the topics he discusses in the video in his new book: Freefall

    Related: There is No Invisible HandFailure to Regulate Financial Markets Leads to Predictable ConsequencesMarket Inefficiencies and Efficient Market TheoryCongress Eases Bank Laws (1999)Volcker on the Great Recession and Need for Reform

  • Where to Invest for Yield Today

    Yields are staying amazingly low today. Due to the credit crisis the federal reserve is shifting hundreds of billions of dollars from savers to bankers to allow banks to make up for losses they experienced (both in losses on bad loans and huge cash payments made to hundreds of executives over more than a decade). For that reason (and others) yields are extremely low now which is a great burden on those that saved and counted on reasonable investment yield.

    Don’t be fooled by apologist for those causing the credit crisis that try and excuse their behavior and act as those paying back the bailout payments means they paid back the favors they were given. They have received much more from the policies of the federal reserve that has taken hundreds of billions of dollars from savers and given it to bankers. It has the same effect as a direct tax on savers being paid to bankers.

    What is an investor/saver to do? James Jubak provides some excellent advice.

    How to maximize what your cash pays even when nothing is paying much of anything now

    A three month Treasury bill pays just 0.12%. A two-year note pays just 0.79%. Inflation may not be very high at an annual rate of 2.6% for headline inflation (and 1.6% minus volatile energy and food prices) but it’s enough to eat up all the interest from those investments and more. (TIPS, Treasury Inflation-Protected Securities will protect you from inflation but the yields are really low (1.43% for a 10-year TIPS at recent auction) and they only protect you from inflation and not rising interest rates. I-Bonds, a savings bond that pays an interest rate that combines a fixed component, currently 0.3%, with an inflation-adjusted variable rate, current 3.06%, offer a higher yield but since the variable rate is pegged to inflation and not interest rates, the yield on these bonds won’t necessarily go up if interest rates do. You also have to hold for at least 12 months. (After that and until you’ve held for 5 years you lose the last 3-months of interest when you sell.)

    You could lock your money up for decades and get 4.56% in a 30-year Treasury bond but 30 years is forever. And besides interest rates have to go up from today’s lows and that means bond prices will be coming down, probably fast enough to eat up all the interest that bond pays and more.

    Not if you remember that interest rates are going up in most of the world (except maybe Europe and Japan) quite dramatically over the next 12 months. A year from now, perhaps sooner, you’ll be able to get yields swell north of anything you can find now.

    That pretty much means that you’re guaranteed to lose money two ways by locking it up for the long term now.

    For the short term you need to put your cash into something that’s as safe as possible but that offers you as much income as possible—and that doesn’t lock up your money for very long.

    My choice dividend paying stocks—if they pay a high dividend, are extremely liquid, and are battle tested.

    Whether you agree with his suggestions in the article is up to you. But even if you don’t he provides a very good overview of the options and risks that you have to navigate now as an investor seeking investments that provide a decent yield. I agree with him that interest rates seem likely to rise, making bonds an investment I largely avoid now myself.

    Related: posts on financial literacyJubak Picks 10 Stocks for Income InvestorsS&P 500 Dividend Yield Tops Bond Yield: First Time Since 1958Bond Yields Show Dramatic Increase in Investor Confidence

  • Manufacturing Driving USA Recovery

    Durables Orders, Home Sales Probably Rose: U.S. Economy Preview

    “Manufacturing is coming back pretty solidly and there is some strength in capital spending,” said Mark Vitner, a senior economist at Wells Fargo Securities LLC in Charlotte, North Carolina. “Housing is definitely a laggard. Until we get job growth and lending eases up, we’re not going to get a whole lot of lift.”

    Federal Reserve Bank of New York President William Dudley last week indicated policy makers are more concerned about maintaining growth than they are about immediate inflation threats.

    Manufacturing, which accounts for 12 percent of the economy, expanded in January at the fastest pace since August 2004, according to the Institute for Supply Management’s factory index released Feb. 1.

    Some manufacturers are also beginning to bring back workers or hire. Caterpillar, the world’s largest maker of bulldozers and excavators, is recalling about 100 laid-off technicians at an Indiana plant because of increased demand and may be hiring more, Bridget Young, a Caterpillar spokeswoman, said Feb. 18.

    “Caterpillar may be recalling or hiring employees in business units at various facilities this year based on demand fluctuation,” Young said.

    Factories added 11,000 workers to payrolls in January, the first increase in three years and the most since April 2006, the Labor Department said on Feb. 5. Overall, payrolls declined by 20,000, and the unemployment rate fell to 9.7 percent.

    Obviously the economic disaster we had been poised to experience due to failed government action the last 10 years and excessive speculation by bankers and wall street has been averted in the short term. But the failure to take seriously the huge risks failed policies (bought by special interests from politicians) put our economy in leaves us at great risk for future problems. The ability to avert disaster so far has been very successful but the danders are still large. But right now the 2010 economy is looking much better than anyone could have hoped for a year ago when disaster seemed likely.

    The problem is that now those politicians, that collected huge payments for the last 20 years for those they have provided huge benefits to (allowing them to carry out strategies that risk the economic well being of the country, bailing them out if the gamblers lose, allowing tens of billion of dollars is profits due to extremely low short term interest rates, that allow dishonest credit card practices, providing tax benefits to the rich that pay the politicians well…), are acting as though the disastrous practices of those they are in bed with are fine. They are setting us up to repeat the same thing again. Which is really not that big a surprise given the lack of character of those we chose to elect.

    Manufacturing has been a strong part of why the economy has been so strong the last few decades. But the politicians has sought to allow those that pay them well to engage in practices that ruin the economy for the benefit of a few speculators.

    Related: Global Manufacturing Employment Data from 1979 to 2007Corrupt Officials Have Fled China With As Much As $100 billionWhy Pay Taxes or be HonestEstate Tax Repeal (another payoff to the rich paying politicians for favors)

  • USA State Governments Have $1,000,000,000,000 in Unfunded Retirement Obligations

    There was a $1 trillion gap at the end of fiscal year 2008 between the $2.35 trillion states had set aside to pay for employees’ retirement benefits and the $3.35 trillion price tag of those promises, according to a new report released by the Pew Center on the States. The shortfall, which will have to be paid over the next 30 years by state and local governments, amounts to more than $8,800 for every household in the United States.

    The figures detailed in Pew’s report, The Trillion Dollar Gap, include pension, health care and other non-pension benefits promised to both current and future retirees in states’ and participating localities’ public sector retirement systems.

    Pew’s numbers likely underestimate the bill coming due because the most recent available data do not account for the second half of 2008, when states’ pension fund investments were particularly affected by the financial crisis. Additionally, most states’ accounting methods spread the investment declines over a period of time–meaning states will be dealing with their losses for several years.

    “While the economic crisis and drop in investments helped create it, the trillion dollar gap is primarily the result of states’ inability to save for the future and manage the costs of their public sector retirement benefits,” said Susan Urahn, managing director, Pew Center on the States. “The growing bill coming due to states could have significant consequences for taxpayers—higher taxes, less money for public services and lower state bond ratings. States need to start exploring reforms.”

    In fiscal year 2008, states’ pension plans had $2.8 trillion in long-term liabilities, with more than $2.3 trillion reserved to cover those costs. Overall, states’ pension systems were 84 percent funded—above the 80 percent funding level recommended by experts. Still, the unfunded portion–$452 billion–is substantial, and states’ performance is down slightly from an 85 percent combined funding level in fiscal year 2006. Pension liabilities have grown by $323 billion since 2006, outpacing asset growth by almost $87 billion.

    Retiree health care and other non-pension benefits, such as life insurance, create another huge bill coming due: a $587 billion total liability to pay for current and future benefits, with only $32 billion–or just over 5 percent of the cost–funded as of fiscal year 2008. Half of the states account for 95 percent of the liability. Because of a 2004 Governmental Accounting Standards Board rule, the full range of non-pension liabilities was officially reported in fiscal year 2008 for the first time across all 50 states.

    Many state and local governments continue to provide very large pay to state and local government employees and often use very generous retirement packages as a way of disguising the true cost of the pay packages they provide.

    Related: NY State Raises Pension Age to Save $48 BillionTrue Level of USA Federal DeficitCharge It to My KidsUSA Federal Debt Now $516,348 Per HouseholdPoliticians Again Raising Taxes On Your ChildrenConsumer Debt Reduced below $2.5 Trillion
    (more…)

  • USA, China and Japan Lead Manufacturing Output in 2008

    Once again the USA was the leading country in manufacturing in 2008. And once again China grew their manufacturing output amazingly. In a change with recent trends Japan grew output significantly. Of course, the 2009 data is going to show the impact of a very severe worldwide recession.

    Chart showing percent of output by top manufacturing countries from 1990 to 2008
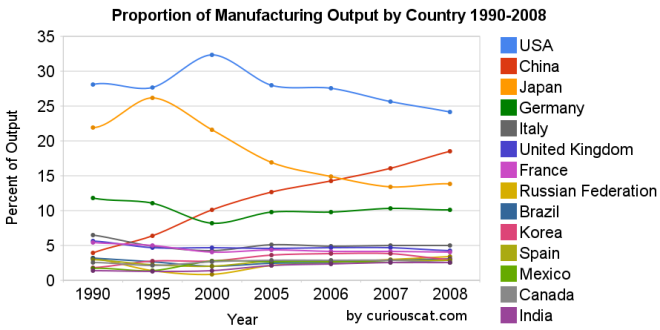
Chart showing the percentage output of top manufacturing countries from 1990-2008 by Curious Cat Management Blog, Creative Commons Attribution.

    The first chart shows the USA’s share of the manufacturing output, of the countries that manufactured over $185 billion in 2008, at 28.1% in 1990, 27.7% in 1995, 32% in 2000, 28% in 2005, 28% in 2006, 26% in 2007 and 24% in 2008. China’s share has grown from 4% in 1990, 6% in 1995, 10% in 2000, 13% in 2005, 14% in 2006, 16% in 2007 to 18% in 2008. Japan’s share has fallen from 22% in 1990 to 14% in 2008. The USA has about 4.5% of the world population, China about 20%. See Curious Cat Investment blog post” Data on the Largest Manufacturing Countries in 2008.

    Even with just this data, it is obvious the belief in a decades long steep decline in USA manufacturing is not in evidence. And, in fact the USA’s output has grown substantially over this period. It has just grown more slowly than that of China (as has every other country), and so while output in the USA has grown the percentage with China has shrunk. The percentage of manufacturing output by the USA (excluding output from China) was 29.3% in 1990 and 29.6% in 2008. The second chart shows manufacturing output over time.

    charts showing the top manufacturing countries output from 1990-2008
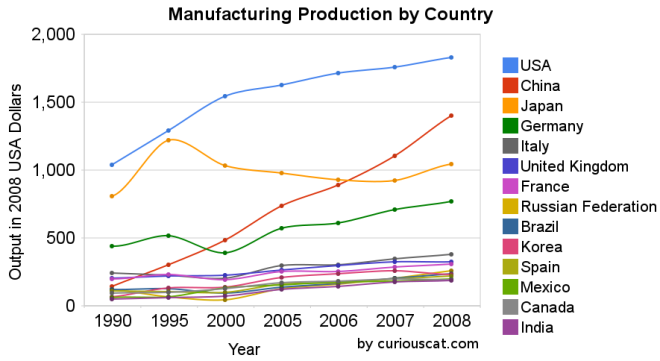
Chart showing the output of the top manufacturing countries from 1990-2008 by Curious Cat Management Blog, Creative Commons Attribution.

    The 2008 China data is not provided for manufacturing alone (the latest UN Data, for global manufacturing, in billions of current USA dollars). The percentage of manufacturing (to manufacturing, mining and utilities) was 78% for 2005-2007 (I used 78% of the manufacturing, mining and utilities figure provided in the 2008 data). There is a good chance this overstates China manufacturing output in 2008 (due to very high commodity prices in 2008).

    Hopefully these charts provide some evidence of what is really going on with global manufacturing and counteracts the hype, to some extent. Global economic data is not perfect. These figures are an attempt to capture the economic reality in the world but they are not a perfect proxy. This data is shown in 2008 USA dollars which is good in the sense that it shows all countries in the same light and we can compare the 1995 USA figure to 2005 without worrying about inflation. However foreign exchange fluctuations over time can show a country, for example, having a decline in manufacturing output in some year when in fact the output increased (just the decline against the USA dollar that year results in the data showing a decrease – which is accurate when measured in terms of USA dollars).

    If the dollar declines substantially between when the 2008 data was calculated and the 2009 data is calculated that will give result in the data showing a substantial increase in those countries that had a currency strengthen against the USA dollar. At this time the Chinese Renminbi has not strengthened while most other currencies have – the Chinese government is retaining a peg to a specific exchange rate.

    Korea (1.8% in 1990, 3% in 2008), Mexico (1.7% to 2.6%) and India (1.4% to 2.5%) were the only countries to increase their percentage of manufacturing output (other than China, of course, which grew from 3.9% to 18.5%).

    Related: posts on manufacturingGlobal Manufacturing Data by Country (2007)Global Manufacturing Employment Data – 1979 to 2007Top 10 Manufacturing Countries 2006Top 10 Manufacturing Countries 2005

  • Initial 4th Quarter Data Show GDP Increased at 5.7% Annual Rate

    Real gross domestic product — the output of goods and services produced by labor and property located in the United States — increased at an annual rate of 5.7% in the fourth quarter of 2009, (that is, from the third quarter to the fourth quarter), according to the “advance” estimate released by the Bureau of Economic Analysis. In the third quarter, real GDP increased 2.2%.

    Real GDP decreased 2.4% in 2009 (that is, from the 2008 annual level to the 2009 annual level), in contrast to an increase of 0.4% in 2008. The price index for gross domestic purchases increased 0.1% in 2009, compared with an increase of 3.2% in 2008.

    The Bureau emphasized that the fourth-quarter advance estimate released today is based on source data that are incomplete or subject to further revision. The “second” estimate for the fourth quarter, based on more complete data, will be released on
    February 26, 2010.

    Related: China GDP up 8.7% in 20092nd Quarter 2009 USA GDP down 1%Japanese Economy Grew at 3.7% Annual Rate in 2nd Quarter 2009

    The increase in real GDP in the fourth quarter primarily reflected positive contributions from private inventory investment, exports, and personal consumption expenditures (PCE). Imports, which are a subtraction in the calculation of GDP, increased.

    The change in real private inventories added 3.39 percentage points to the fourth-quarter change in real GDP after adding 0.69 percentage point to the third-quarter change. Private businesses decreased inventories $33.5 billion in the fourth quarter, following decreases of $139.2 billion in the third quarter and $160.2 billion in the second. Real final sales of domestic product — GDP less change in private inventories — increased 2.2% in the fourth quarter, compared with an increase of 1.5% in the third.
    (more…)

  • Statistics on Entrepreneurship

    Some statistics from the Kauffman Foundation

    • From 1980–2005, firms less than five years old accounted for all net job growth in the United States.
    • More than half of the companies on the 2009 Fortune 500 list were launched during a recession or bear market, along with nearly half of the firms on the 2008 Inc. list of America’s fastest-growing companies.
    • Contrary to popularly held assumptions, the highest rate of entrepreneurial activity belongs to the 55–64 age group over the past decade. The 20–34 age bracket has the lowest.
    • Only 16 percent of the fastest-growing and most successful companies in the United States had venture investors.
    • More than a quarter of technology and engineering companies started in the United States from 1995 to 2005 had at least one key founder who was foreign-born.
    • Foreign nationals residing in the United States were named as inventors or co-inventors in 25.6 percent of international patent applications filed in the U.S. in 2006.

    Related: Y-Combinator’s Fresh Approach to EntrepreneurshipEntrepreneur ResultsKiva Fellows Blog: Nepalese Entrepreneur Success