Tag: curiouscat

  • Will The Savings Rate Fall Back Again

    Welcome to the False Recovery by Eric Janszen

    Because of the way the government measures household savings, the increase doesn’t signify more money in people’s wallets; instead, it suggests that consumers are paying off their mounting debt during a period of reduced borrowing. That’s no harbinger of growth.

    Companies planning for sudden and relatively near-term growth should reshape their strategies to make the best of economic flatness.

    He makes a decent point for companies, but the he flips back and forth between the need to save more (because we are buried in debt) and the need to spend more (because we need to grow the economy right now). And while I wouldn’t stake my life on it I wouldn’t be surprised that we have a strong economic rebound (it is also perfectly conceivable we have a next to no growth or even fall into a recession). But it seems to me the return to bubble thinking and spending beyond our means is making a strong comeback.

    The money is not going under mattresses or into bank accounts, from where it will emerge one day to jump-start the economy. It’s actually subsidizing the previous boom, which was built on debt and the presumption that assets would always cover that debt.

    Another ok, point but we have hardly paying off anything of the previous living beyond our means. It would take decades at this rate.

    Banks can loosen lending policies to allow people to borrow and spend again—but for that to solve anything, consumers must be extremely judicious in how they take on and use their debt. It’s more likely that consumer debt levels will rise again as individuals stretch themselves to afford what they want. Alas, this will drive the reported savings rate back down. By the end of 2010, I expect it to dip below 3%. Then, any drop in asset values will set off the debt trap. We’ll again see a rising savings rate and tightened lending, followed by loosened lending and a declining savings rate. The recovery will become a series of starts and stops: promising progress, periods of retreat.

    So the problem is the saving are not actually resulting in increased ability to spend (first point above) – which is bad he says, because it means their won’t be more spending (because people won’t have the ability to spend). Then he says when banks lend the consumers money they will spend and the saving rate will go down (which is bad – though he doesn’t seem to really want more savings (because that means business won’t get increased sales).

    The conventional wisdom likes to point out the long term problem of low savings rate but then quickly point out we need more spending or the economy will slow. Yes, when you have an economy that is living beyond its means if you want to address the long term consequences of that it means you have to live within your means. It isn’t tricky. We need to save more. If that means the economy is slower compared to when we lived beyond our means that is what it takes. The alternative is just to live beyond your means for longer and dig yourself deeper into debt.
    (more…)

  • Real Estate and Consumer Loan Delinquency Rates 1998-2009

    The chart shows the total percent of delinquent loans by commercial banks in the USA.

    charts showing loan delinquency rates in the USA, 1998-2009

    That last half of 2009 saw real estate delinquencies continue to increase. Residential real estate delinquencies increased 143 basis points to 10.14% and commercial real estate delinquencies in 98 basis points to 8.81%. Agricultural loan delinquencies also increased (112 basis points) though to just 3.24%. Consumer loan delinquencies decreased with credit card delinquencies down 18 basis points to 6.4% and other consumer loan delinquencies down 19 basis points to 3.49%.

    Related: Loan Delinquency Rates Increased Dramatically in the 2nd QuarterBond Rates Remain Low, Little Change in Late 2009Government Debt as Percentage of GDP 1990-2008 – USA, Japan, Germany… posts with charts showing economic data
    (more…)

  • 11 Stocks for 10 Years – March 2010 Update

    I created the 10 stocks for 10 years portfolio in April of 2005. In order to track performance created a marketocracy portfolio but had to make some minor adjustments (and marketocracy doesn’t allow Tesco to be purchased, though it is easily available as an ADR to anyone in the USA to buy in real life – it is based in England). The current marketocracy calculated annualized rate or return (which excludes Tesco) is 6.2% (the S&P 500 annualized return for the period is 2.5%) – marketocracy subtracts the equivalent of 2% of assets annually to simulate management fees – as though the portfolio were a mutual fund – so without that the return is about 5.7% above the S&P 500 annually).

    The current stocks, in order of return:

    Stock Current Return % of sleep well portfolio now % of the portfolio if I were buying today
    Amazon – AMZN 248% 11% 8%
    Google – GOOG 152% 16% 15%
    PetroChina – PTR 87% 9% 9%
    Templeton Dragon Fund – TDF 80% 10% 10%
    Templeton Emerging Market Fund – EMF 40% 5% 6%
    Cisco – CSCO 38% 6% 8%
    Danaher – DHR 10% 9% 10%
    Toyota – TM 10% 8% 10%
    Intel – INTC 0% 4% 7%
    Tesco – TSCDY -10%* 0%* 10%
    Pfizer – PFE -34% 4% 8%
    Dell -56% 3% 0%

    The current marketocracy results can be seen on the Sleep Well portfolio page.

    Related: 12 Stocks for 10 Years – July 2009 UpdateInvesting, My Thoughts at the End of 2009posts on stocksinvesting books
    (more…)

  • USA, China and Japan Lead Manufacturing Output in 2008

    Once again the USA was the leading country in manufacturing in 2008. And once again China grew their manufacturing output amazingly. In a change with recent trends Japan grew output significantly. Of course, the 2009 data is going to show the impact of a very severe worldwide recession.

    Chart showing percent of output by top manufacturing countries from 1990 to 2008
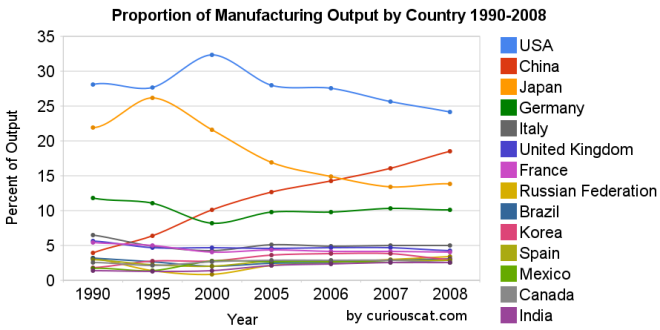
Chart showing the percentage output of top manufacturing countries from 1990-2008 by Curious Cat Management Blog, Creative Commons Attribution.

    The first chart shows the USA’s share of the manufacturing output, of the countries that manufactured over $185 billion in 2008, at 28.1% in 1990, 27.7% in 1995, 32% in 2000, 28% in 2005, 28% in 2006, 26% in 2007 and 24% in 2008. China’s share has grown from 4% in 1990, 6% in 1995, 10% in 2000, 13% in 2005, 14% in 2006, 16% in 2007 to 18% in 2008. Japan’s share has fallen from 22% in 1990 to 14% in 2008. The USA has about 4.5% of the world population, China about 20%. See Curious Cat Investment blog post” Data on the Largest Manufacturing Countries in 2008.

    Even with just this data, it is obvious the belief in a decades long steep decline in USA manufacturing is not in evidence. And, in fact the USA’s output has grown substantially over this period. It has just grown more slowly than that of China (as has every other country), and so while output in the USA has grown the percentage with China has shrunk. The percentage of manufacturing output by the USA (excluding output from China) was 29.3% in 1990 and 29.6% in 2008. The second chart shows manufacturing output over time.

    charts showing the top manufacturing countries output from 1990-2008
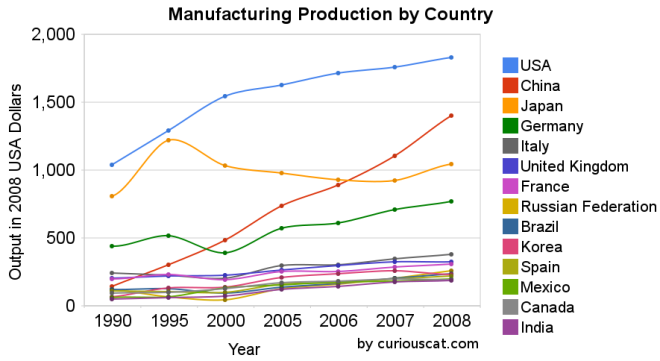
Chart showing the output of the top manufacturing countries from 1990-2008 by Curious Cat Management Blog, Creative Commons Attribution.

    The 2008 China data is not provided for manufacturing alone (the latest UN Data, for global manufacturing, in billions of current USA dollars). The percentage of manufacturing (to manufacturing, mining and utilities) was 78% for 2005-2007 (I used 78% of the manufacturing, mining and utilities figure provided in the 2008 data). There is a good chance this overstates China manufacturing output in 2008 (due to very high commodity prices in 2008).

    Hopefully these charts provide some evidence of what is really going on with global manufacturing and counteracts the hype, to some extent. Global economic data is not perfect. These figures are an attempt to capture the economic reality in the world but they are not a perfect proxy. This data is shown in 2008 USA dollars which is good in the sense that it shows all countries in the same light and we can compare the 1995 USA figure to 2005 without worrying about inflation. However foreign exchange fluctuations over time can show a country, for example, having a decline in manufacturing output in some year when in fact the output increased (just the decline against the USA dollar that year results in the data showing a decrease – which is accurate when measured in terms of USA dollars).

    If the dollar declines substantially between when the 2008 data was calculated and the 2009 data is calculated that will give result in the data showing a substantial increase in those countries that had a currency strengthen against the USA dollar. At this time the Chinese Renminbi has not strengthened while most other currencies have – the Chinese government is retaining a peg to a specific exchange rate.

    Korea (1.8% in 1990, 3% in 2008), Mexico (1.7% to 2.6%) and India (1.4% to 2.5%) were the only countries to increase their percentage of manufacturing output (other than China, of course, which grew from 3.9% to 18.5%).

    Related: posts on manufacturingGlobal Manufacturing Data by Country (2007)Global Manufacturing Employment Data – 1979 to 2007Top 10 Manufacturing Countries 2006Top 10 Manufacturing Countries 2005

  • Retirement Savings Allocation for 2010

    I adjusted my future retirement account 401(k) allocations today. I do not have as favorable an opinion of investing in the stock market today as I did a year ago. I would likely have allocated 20% to a money market fund except my 401(k) actually has two options – 1 paying 0.0% and the other paying -.02%.

    They seem to believe they should make a significant profit while providing a horrible return (they are still taking over .5% of assets in fees – even though rates do not cover their fees). Those running funds have very little interest in providing value for 401(k) participants – they are mainly interested in raising fees (though supposedly they are suppose to be run by people with a fiduciary responsibility to the investors). Unfortunately most 401(k)s lock you away from the best options for an investor (such as Vanguard Funds).

    My current allocation for future funds is 40% to USA stocks, 40% to Global stocks and 20% to inflation adjusted bonds. My current allocation in this retirement account is 10% real estate, 35% global stocks, 55% USA stocks. For all my retirement savings it is probably about 5% real estate, 35% global stocks, 5% money market, 55% USA stocks (which is a fairly aggressive mix).

    As I have said many times I do not like bonds at this time. I don’t think the interest nearly justifies the risk of capital loss (due to inflation or interest rate risk). Inflation protected bonds are a much more acceptable option for someone that is worried about inflation (like I am over the next 10-20 years).

    A number of the stock fund (even bond fund) options in my 401(k) have expense ratios above 1%. That is unacceptable. The average fees on the options I chose were .5%.

    With my employee match I am adding over 10% of my income to my 401(k), which I think is a good aim for most everyone. Far too many people are unwilling to forgo luxuries to save appropriately for their retirement. This is a sign of financial illiteracy and an unwillingness to accept the responsibilities of modern life.

    Related: Investing – My Thoughts at the End of 2009401(k)s are a Great Way to Save for RetirementSaving for RetirementManaging Retirement Investment Risks

  • USA Spends Record $2.3 trillion ($7,681 Per Person) on Health Care in 2008

    Nominal health spending in the United States grew 4.4% in 2008, to $2.3 trillion or $7,681 per person. This was the slowest rate of growth since the Centers for Medicare & Medicaid Services started officially tracking expenditures in 1960, yet once again outpaced nominal GDP growth (2.6% in 2008). This brings health care spending to 16.2% of GDP. In 2003 the total health care spending was 15.3% of GDP.

    The huge amount being spent continues to grow to an even larger percentage of GDP every year. The damage to the economy of the dysfunctional health care system in the USA is huge. For comparison the total GDP per person in China is $5,970 (the closest total country per capita GDP, to the health care spending per capita in the USA, is Thailand at $7,703 – World Bank data). The average spending by OECD countries (Europe/USA/Japan…) was $2,966 per person in 2007 (the USA was at $7,290). In 2007 Canada spent $3,895; France $3,601; UK $2,992; Japan $2,581.

    • Hospital spending in 2008 grew 4.5% to $718 billion, compared to 5.9% in 2007, the slowest rate of increase since 1998.
    • Physician and clinical services’ spending increased 5.0% in 2008 to $496 billion, a deceleration from 5.8% in 2007.
    • Retail prescription drug spending growth also decelerated to 3.2% in 2008 as per capita use of prescription medications declined slightly, mainly due to impacts of the recession, a low number of new product introductions, and safety and efficacy concerns. Drug prices increased 2.5% in 2008.
    • Spending growth for both nursing home and home health services decelerated in 2008. For nursing homes, spending grew 4.6% in 2008 compared to 5.8% in 2007.
    • Total health care spending by public programs, such as Medicare and Medicaid, grew 6.5% in 2008, the same rate as in 2007.
    • Health care spending by private sources of funds grew only 2.6% in 2008 compared to 5.6 percent in 2007.
    • Private health insurance premiums grew 3.1% in 2008, a deceleration from 4.4% in 2007. Remember many people lost their jobs and did without insurance. Doing so results in reduced spending on health insurance but is far from a good sign.
    • Home health care spending growth decelerated from 11.8% in 2007 to 9.0% in 2008. Expenditures reached $64.7 billion in 2008. You can understand why investors (and companies) are looking to invest in home health care.

    At the aggregate level, the shares of financing for health services and supplies by businesses (23%), households (31%), other private sponsors (3%), and governments (42%) have remained relatively steady over time. Between 2007 and 2008; however, the federal government share increased significantly (from 23 to 25%), while the state and local government share declined (from 18 to 17%).

    Decades ago Dr. Deming included excessive health care costs as one of the seven deadly diseases of western management. We have only seen the problem get worse. Finally it seems that a significant number of people are in agreement that the system is broken.
    (more…)

  • Investing – My Thoughts at the End of 2009

    In December 2008 I decided to substantially increase my investments in the stock market. This turned out to be quite successful. As I said at the time, the economy continues to struggle and the prospects for 2009 did not look good. And I even guessed the stock market (in the USA) would be lower 12 months from now. But, I also said I was far from certain, in that guess and that I had been increasing my stock investment and would continue to do so.

    At this time my retirement contributions are going 100% to stock investments (if I were close to retirement I would not do this). I am likely going to reduce the contributions going forward (maybe 75% stocks – 25% money market). Unfortunately my retirement fund does not have great alternatives – it has very good real estate options but I am not ready to start putting new funds there (though I likely will during 2010, at some point).

    I did sell reduce my equity exposure in a retirement account that I am not adding to this month. It reduced my overall equity exposure of my portfolio by a couple percentage points, at most. It is still significantly higher than a year ago, due to the incredible gains for 2009 in my stock investments.

    Last year I fully fund my Roth IRA, in January and bought Amazon (AMZN), Templeton Emerging Market Fund (EMF) and PetroChina (PTR). I will fully fund the Roth IRA in January again. I am leaning toward some combination of Templeton Emerging Market Fund (EMF), Vanguard Emerging Markets Stock (VWO), Toyota (TM) and maybe Danaher (DHR). I purchased all of those in my non-retirement account in 2009.

    Investing well is not easy. Saving money is though, sometime people get these confused. You need to save money for retirement – aim for 10% of your income and invest that conservatively if you do not wish to focus on investing. I have no question fully funding your Roth IRA is a wise move for almost everyone. How to invest once you do that is a bit trickier but funding it is not a difficult question to answer. It was not easy to increase investments into stocks last year, when so many others were selling (and the press is full of stories reinforcing the bad news, bad prospects and risks). You can get great opportunities when others are panicking, but things do not always recovery so nicely.

    What the next year holds, again for 2010, if very difficult to see. The economy looks to be in much better shape than a year ago. But it is far from strong. And the recovery in the stock market means the higher prices stocks command today leave more downside risk for stocks, if things do not go well. I am more concentrated in stocks now than I was a year ago, but I am not comfortable with that. I don’t see bonds, even short term bonds, as an acceptable alternative. The risks are not at all justified by the returns in my opinion. I am happy with my real estate investments and may even look to increase that area though I think it may be too early for commercial real estate. I think individual companies may well prosper even if the economy falters – such as Google, Amazon, Danaher, Toyota, Tesco (though Amazon’s price increases may already have more than accounted for this) – all of these are in my 12 stocks for 10 years portfolio.

    Related: Save Some of Each RaiseIt is Never to Late to InvestDoes a Declining Stock Market Worry You?Uncertain Economic Times

  • Using Outcome Measures for Prison Management

    What is the aim of prison? To keep criminals locked up so they can’t commit crimes in society is another. Punishment, in order to deter people from committing crime is one reason they exist. And you would hope to mold prisoners so they do not commit crimes when they are freed. But the payment for services does not factor in the results of releasing productive members of society. It seems like doing so could result in improvements.

    Better Jails by Andrew Leigh, economics professor, Australian National University

    Prisons do reduce crime, but mainly because of what criminologists call ‘the incapacitation effect’ (when you’re doing time in Long Bay, it’s harder to hotwire a car). There may also be some deterrence effect, but this is small by comparison. And there is little evidence of a rehabilitation effect.

    To encourage innovation, we should start publicly reporting the outcomes that matter most. Rather than merely telling the public how many people are held in each jail, governments should publish prison-level data on recidivism rates and employment rates.

    As well as focusing on the important outcomes, Australian states should rethink the contracts they write with private providers. At present, about 16% of inmates are held in a private jail. Unfortunately, the contracts for private jails bear a remarkable similarity to sheep agistment contracts.

    Providers are penalised if inmates harm themselves or others, and rewarded if they do the paperwork correctly. Yet the contracts say nothing about life after release. A private prison operator receives the same remuneration regardless of whether released inmates lead healthy and productive lives, or become serial killers.

    A smarter way to run private jails would be to contract for the outcomes that matter most. For example, why not pay bonus payments for every prisoner who holds down a job after release, and does not reoffend? Given the right incentives, private prisons might be able to actually teach the public sector a few lessons on how to run a great rehabilitation program.

    The idea of paying for outcomes is great. It makes sense for some pay to be based on keeping prisoners housed during their terms. But providing incentives for achievement in returning productive people back to free society is something we should try.

    Related: Lean Management in PolicingUrban PlanningRich Americans Sue to Keep Evidence of Their Tax Evasion From the Justice DepartmentRandomization in SportsLA Jail Saves Time Processing CrimeMeasuring and Managing Performance in Organizations
    Quality Improvement and Government: Ten Hard Lessons From the Madison Experience by David C. Couper, Chief of Police, City of Madison, Wisconsin
    (more…)

  • If you Can’t Explain it, You Can’t Sell It

    Over the last few years Elizabeth Warren has become one of my favorite leaders. She is a leader in economic thought, ethical society and the law (she is a law professor at Harvard Law School). Far too many on Wall Street, Washington and in C-suites are leading us down a very bad path. She is a voice we need to heed.

    If you can’t explain it, you can’t sell it

    “We need a new model: If you can’t explain it, you can’t sell it,”

    The 1966 high school debate champion of Oklahoma may get what she wants. The House of Representatives will vote in December on her idea. She suggested a Financial Product Safety Commission in a 2007 article in the magazine Democracy [Unsafe at Any Rate]. President Barack Obama proposed it to Congress in June as the Consumer Financial Protection Agency.

    Warren won’t discuss whether she may be a candidate to lead the authority, which would have the power to regulate $13.7 trillion of debt products. A Warren nomination would tell banks that Obama is determined to force reduced checking-account fees and limit lender claims in mortgage advertising, among other measures the industry opposes, said Thomas Cooley, dean of New York University’s Stern School of Business.

    In her role overseeing the TARP, Warren has been critical of the administration, accusing the Treasury Department of undervaluing the stock warrants that were supposed to compensate taxpayers when banks repay their bailouts. A lack of transparency about how TARP functions “erodes the very confidence” it was to restore, her committee said in a report.

    I hope she can take her attempts to reduce political favors being granted huge financial institutions and those institution be forced to follow sensible rules to protect individuals and our economy. With a few more people like there we will have a much better chance of a positive economic future.

    Related: Bogle on the Retirement CrisisBankruptcies Among Seniors SoaringDon’t Let the Credit Card Companies Play You for a Foolhttp://investing.curiouscatblog.net/2009/04/08/the-best-way-to-rob-a-bank-is-as-an-executive-at-one/

  • Up to $6,500 Credit to Reduce Your Energy Bills

    The Federal Weatherization Assistance Program has been around for decades and funding has been increased as part of the stimulus bills. This type of spending is better than much of what government does. It actually invests in something with positive externalities. It targets spending to those that need help (instead of say those that pay politicians to give their companies huge payoffs and then pay themselves tens of millions in bonuses).

    The Depart of Energy provides funding, but the states run their own programs and set rules for issues such as eligibility. They also select service providers, which are usually nonprofit agencies that serve families in their communities, and review their performance for quality. In many states the stimulus funds have increased the maximum funds have increased to $6,500 per household, from $3,000.

    The weatherization program targets low-income families: those who make $44,000 per year for a family of four (except for $55,140 for Alaska and $50,720 for Hawaii).

    The program provides funds for those with low-income for the like of: insulation, air sealing and at times furnace repair and replacement. Taking advantage of this program can help you reduce your energy bills and reduce the amount of energy we use and pollution created. And it employs people to carry out these activities.

    The Weatherization Assistance Program invests in making homes more energy efficient, reducing heating bills by an average of 32% and overall energy bills by hundreds of dollars per year.

    Weatherization is also often a very good idea without any government support. If you are eligible for some help, definitely take a look at whether it makes sense for you. And even if you are not, it is a good idea to look into saving on your energy costs.

    Related: Oil Consumption by Country in 2007Japan to Add Personal Solar Subsidiespersonal finance tipsKodak Debuts Printers With Inexpensive CartridgesPersonal Finance Basics: Dollar Cost Averaging
    (more…)