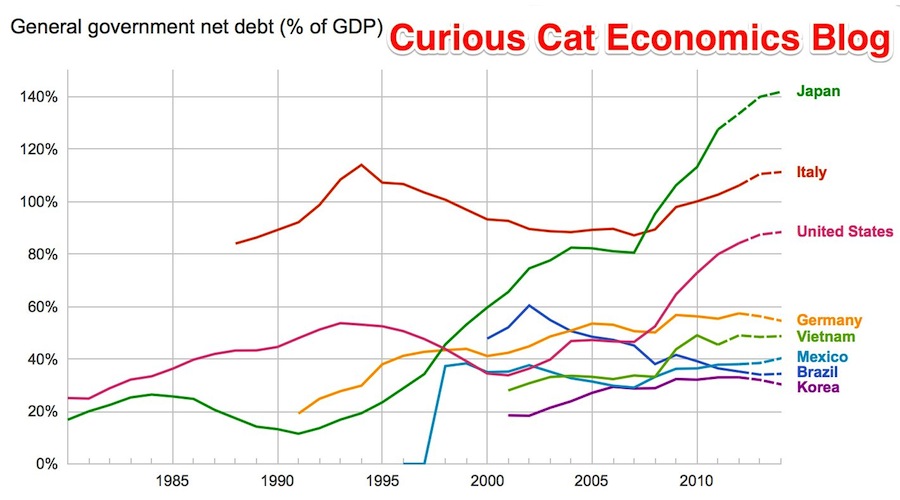
The data, from IMF, does not include China or India.
The chart shows data for net debt (gross debt reduced by certain assets: gold, currency deposits, debt securities etc.).
Bloomberg converted [broken link was removed] the data to look at debt load per person (looking at gross debt – estimated for 2014). Japan has ill-fortune to lead in this statistic with $99,725 in debt per person (242% of GDP), Ireland is in second with $60, 356 (121% of GDP). USA 3rd $58,604 (107%). Singapore 4th $56,980 (106%). Italy 6th $46,757 (133%). UK 9th $38,939 (95%). Greece 12th $38,444 (174%). Germany 14th $35,881 (78%). Malaysia 32nd $6,106 (57%). China 48th $1,489 (21%). India 53rd $946 (68%). Indonesia 54th $919 (27%).
I think the gross debt numbers can be more misleading than net debt figures. I believe Singapore has very large assets so that the “net” debt is very small (or non-existent). Japan is 242% in gross debt to GDP but 142% of net debt (which is still huge but obviously much lower). The USA in contrast has gross debt at 107% with a net debt of 88%.
Related: Government Debt as Percent of GDP 1998-2010 for OECD – Gross Government Debt as Percentage of GDP 1990-2009: USA, Japan, Germany, China – Chart of Largest Petroleum Consuming Countries from 1980 to 2010 – Top Countries For Renewable Energy Capacity
Leave a Reply to Government Debt Held Within the Country Versus That Held Externally at Curious Cat Investing and Economics Blog Cancel reply