Category: economy

  • USA New Homes Plunged in May to Record Low

    Sales of new single-family houses in May 2010 were at a seasonally adjusted annual rate of 300,000, according to estimates released jointly today by the U.S. Census Bureau and the Department of Housing and Urban Development. This is 33% below the revised April rate of 446,000 and is 18% below the May 2009 estimate of 367,000.

    The median sales price of new houses sold in May 2010 was $200,900; the average sales price was $263,400. The seasonally adjusted estimate of new houses for sale at the end of May was 213,000. This represents a supply of 8.5 months at the current sales rate.

    300,000 is a new all time low annual rate of new home sales (data has been reported since 1963). This follows the end of the federal governments tax credit for those buying their first home. New houses sold:

    2003 1,086,000
    2004 1,203,000
    2005 1,283,000
    2006 1,051,000
    2007 776,000
    2008 485,000
    2009 375,000

    This is not a good sign for the economy. At the same time, we have to absorb the overbuilding bankers financed a few years ago. The damage that caused is still being dealt with. The low number of new home sales provides us some bad news on how bad things were. Until new home sales rebound to over 600,000 a year this will be a large drain on the ability to grown jobs and the economy. You have to go back to 1991 to find a year with fewer than 600,000 (other than the last 2, of course).

    Related: Most Vacant New Homes Since Records Kept (1973), from March 2008Mortgage Foreclosure Rate Reaches Record 4.63%Housing Rents Falling in the USA (Feb 2009)

  • USA Consumer Debt Stands at $2.44 Trillion

    Consumer debt grew by about $100 billion each year from 2004 through 2007. In 2009 it has fallen over $112 billion so far: from $2,561 billion to $2,449 billion. Through April of 2010 total outstanding consumer debt $9 billion (so essentially it has been at a standstill). This still leaves over $8,000 in consumer debt for every person in the USA and $20,000 per family.

    The huge amount of outstanding consumer and government debt remains a burden for the economy. At least some progress is being made to decrease consumer debt.

    Those living in USA have consumed far more than they have produced for decades. That is not sustainable. You don’t fix this problem by encouraging more spending and borrowing: either by the government or by consumers. The long term problem for the USA economy is that people have consuming more than they have been producing.

    The solution to this problem is to stop spending beyond your means by even increasing levels of personal and government debt. Thankfully over the last year at least consumer debt has been declining. Government debt has been exploding so unfortunately that problem has continued to get worse.

    Data from the federal reserve.

    Related: Consumer Debt Declined a Record $21.5 Billion in JulyThe USA Economy Needs to Reduce Personal and Government Debt

  • Global Economy Prospects Look Good But Also at Risk

    Fear returns

    The MSCI index of global stocks has fallen by over 15% since mid-April. Treasury yields have tumbled as investors have fled to the relative safety of American government bonds.

    Fears are growing that the global recovery will falter as Europe’s debt crisis spreads, China’s property bubble bursts and America’s stimulus-fuelled rebound peters out.

    Fears about the fragility of the global recovery are exaggerated. Led by big emerging economies, the world’s output is probably growing at an annual rate of more than 5%, far swifter than most seers expected.

    America’s structural budget deficit will soon be bigger than that of any other OECD member, and the country badly needs a plan to deal with it. But for now, lower bond yields and a stronger dollar are the route through which American spending will rise to counter European austerity. Thanks to its population growth and the dollar’s role as a global currency, America has more fiscal room than any other big-deficit country. It has been right to use it.

    The world is nervous for good reason. Although the fundamentals are reasonably good, the judgment of politicians is often unreasonably bad. Right now that is what poses the biggest risk to the world economy.

    Some very good thoughts from the Economist. As always there are plenty of risks to focus on today. There are also plenty of reasons to be optimistic. It looks like globally we are in for a good economy in 2010-2011 but those prospects could worsen fairly easily.

    Related: India Grew GDP 8.6% in First QuarterConsumer Debt Needs to Decline Much MoreGovernment Debt as Percentage of GDP 1990-2008 – USA, Japan, Germany…

  • Unemployment Rate Drops to 9.7% But Job Gains Disappoint

    Total nonfarm payroll employment grew by 431,000 in May but that total includes the hiring of 411,000 temporary employees to work on Census 2010, the U.S. Bureau of Labor Statistics reported today. Private-sector employment changed little (+41,000). Manufacturing, temporary help services, and mining added jobs, while construction employment declined. Economists were predicting over 500,000 job gains (given the large number of temporary census hires).

    In order to substantially increase the job prospects going forward we need to average over 250,000 new jobs a month to make up for the lost jobs due to the credit crisis. The economy needs to gain about 125,000 jobs a month to keep up with population growth. The temporary census jobs help but those jobs are temporary so can’t be counted on for long term improvement in the job picture.

    The number of unemployed persons was 15.0 million in May. The unemployment rate edged down to 9.7 percent, the same rate as in the first 3 months of 2010. The unemployment rates for adult men stand at 9.8%, 8.1% for adult women and 26.4% for teenagers.

    In May, the number of long-term unemployed (those jobless for 27 weeks and over) was about unchanged at 6.8 million. These individuals made up 46.0 percent of unemployed persons, about the same as in April.

    In May, the civilian labor force participation rate edged down by 20 basis points to 65%. The employment-population ratio was about unchanged over the month at 58.7%.

    Among the marginally attached, there were 1.1 million discouraged workers in May, up by 291,000 from a year earlier. (The data are not seasonally adjusted.) Discouraged workers are persons not currently looking for work because they believe no jobs are available for them. The remaining 1.1 million persons marginally attached to the labor force had not searched for work in the 4 weeks preceding the survey for reasons such as school attendance or family responsibilities.

    Manufacturing employment has risen by 126,000 over the past 5 months. Within manufacturing, both fabricated metals and machinery added jobs in May. Temporary help services added 31,000 jobs over the month; employment in the industry has risen by 362,000 since September 2009.

    Government employment rose by 390,000 in May. The Federal government hired 411,000 temporary workers for Census 2010, bringing total temporary census staffing during the payroll survey reference period to 564,000. Employment in state government excluding education decreased by 13,000.

    In May, the average workweek for all employees on private nonfarm payrolls increased by 0.1 hour to 34.2 hours. The manufacturing workweek for all employees increased by 0.3 hour to 40.5 hours. The average workweek for production and nonsupervisory employees on private non-
    farm payrolls increased by 0.1 hour to 33.5 hours over the month.

    Average hourly earnings of all employees in the private nonfarm sector increased by 7 cents, or 0.3 percent, to $22.57 in May. Over the past 12 months, average hourly earnings have increased by 1.9 percent. In May, average hourly earnings of private-sector production and nonsupervisory employees increased by 4 cents, or 0.2 percent, to $18.99.

    The change in total nonfarm payroll employment for March was revised from +230,000 to +208,000, while the change for April remained at +290,000.

    Related: USA Added 290,000 Jobs In AprilUnemployment Rate Reached 10.2% (Nov 2009)Another 663,000 Jobs Lost in March, 2009 in the USA

  • Buffett Expects Terrible Problem for Municipal Debt

    Buffett Expects “Terrible Problem” for Municipal Debt

    “There will be a terrible problem and then the question becomes will the federal government help,” Buffett, 79, said today at a hearing of the U.S. Financial Crisis Inquiry Commission in New York. “I don’t know how I would rate them myself. It’s a bet on how the federal government will act over time.”

    Berkshire’s investment portfolio included municipal bonds valued at less than $3.9 billion as of March 31, down from more than $4.7 billion at the end of 2008. The company had a maximum of $16 billion at risk in derivatives tied to such debt, according to the company’s annual report for 2009.

    Buffett said last month that the U.S. may feel compelled to rescue a state facing default after the government committed $700 billion to bail out financial firms and automakers. “It would be hard in the end for the federal government to turn away a state having extreme financial difficulty when they’ve gone to General Motors and other entities and saved them,”

    About $14.5 billion of municipal bonds defaulted in 2008 and 2009… Many those were securities backed by revenue from nursing homes, property developments and other projects without claim to government tax revenue.

    Defaults by local governments with the power to raise taxes are less common. Jefferson County, Alabama, defaulted on more than $3 billion of bonds backed by sewer fees after the deals grew more costly in the wake of the credit crisis in 2008. Vallejo, California, filed for bankruptcy in 2008 after its tax revenue tumbled.

    Related: USA State Governments Have $1,000,000,000,000 in Unfunded Retirement ObligationsBuffett on Need to Reduce Government DeficitsPoliticians Again Raising Taxes On Your Children

  • India Grew GDP 8.6% in First Quarter

    While Europe’s financial crisis continues India grew GDP by 8.6% in the first 3 months of 2010. China continues to grow quickly as do many emerging countries, including Brazil. India’s Q4 GDP grows at 8.6% y-o-y

    The 8.6 percent expansion in the fourth quarter of the fiscal year 2009/10 was broadly in line with a median forecast of 8.7 percent in a Reuters poll and lifted the annual average growth rate for the full fiscal year to a slightly better-than-expected 7.4 percent.

    India’s economy had grown 6.7 percent in 2008/09, and the Jan-March 2009/10 growth rate matches the revised data for the second quarter of 2009/10.

    Manufacturing output grew 16.3 percent on year in the quarter as consumers bought more cars and other goods, while farm output grew an annual 0.7 percent helped by a good winter harvest. The government expects the economy to grow 8.5 percent in the current fiscal year that started on April 1 on the prospects of a better farm output and a global recovery

    The farm sector, which forms nearly 17 percent of the economy but is dependent on monsoon rains, is expected to do well in 2011 as the weather office has predicted a normal monsoon for the country. Prime Minister Manmohan Singh last week said an annual economic growth rate of 10 percent is needed in the medium term to address the problems of poverty and malnutrition.

    Even as Singh aims for high economic growth, inflation has come to haunt his government and appears to be undermining its support base. Wholesale prices, the most closely watched inflation gauge in India, rose 9.59 percent in April from a year earlier amid the government officials claim that headline inflation had peaked.

    Headline inflation numbers have been consistently higher than the official forecasts. The wholesale price inflation vaulted above the RBI’s end-March 2010 inflation forecast of 8.5 percent in January and crossed the 10-percent mark in February.

    Although food price inflation has eased from its peak of 20 percent in December, it is still above 16 percent. Rising cost pressures are also dragging down the pace of manufacturing growth, as evidenced by a second-straight monthly decline in the HSBC Market Purchasing Managers’ Index in April. The rapid acceleration in the world’s second-fastest growing major economy after China is boosting consumer demand far ahead of what can be met by existing supply capacity.

    The economies of India, China, Brazil, Mexico, Thailand, Vietnam… are still a fairly small fraction of global GDP but their share continues to grown. And the next few years look to continue this trend. Keys to how quickly they grow their share of global GDP are avoiding bubbles (which then burst), avoiding excessive government debt, continuing to build strong infrastructure for continued development and to what extent growth slows in Europe, USA and Japan due to the credit crisis and excessive consumer and government debt.

    The emerging economies have done a good job avoiding the credit crisis failures visited by the large banks on the wealthiest economies but the dangers of slipping up are large and costly. The largest economies have lots of wealth even after allowing bankers and wall street to siphon off huge amounts for themselves. Less wealth economies will suffer much more than the wealthiest countries if they fall prey to the same political and economic failings. And those special interest (crony capitalism) favors are no less (I would say even more, in fact) likely in those countries than they are in the richest countries.

    Related: The Relative Economic Position of the USA is Likely to DeclineEasiest Countries for Doing Business 2008Why Investing is Safer Overseas

  • Increasing USA Foreign Oil Dependence In The Last 40 years

    In his presentation Mike Milken explores foreign oil dependence for the USA and presidential statements:

    President Richard Nixon (in 1974 with 36.1% of oil from foreign sources): “At the end of this decade, in the year 1980, the United States will not be dependent on any other country for the energy we need.”

    President Gerald Ford (in 1975 with 36.1% of oil from foreign sources): “We must reduce oil imports by one million barrels per day by the end of this year and by two million barrels per day by the end of 1977.”

    President Jimmy Carter (1979, 40.5%): “Beginning this moment, this nation will never use more foreign oil than we did in 1977 – never.”

    President Ronald Reagan (1981, 43.6%): “While conservation is worthy in itself, the best answer is to try to make us independent of outside sources to the greatest extent possible for our energy.”

    President George Bush (1992, 47.2%): “When our administration developed our national energy strategy, three principles guided our policy: reducing our dependence on foreign oil…”

    President Bill Clinton (1995, 49.8%): “The nation’s growing reliance on imports of oil… threatens the nation’s security… [we] will continue efforts to…enhance domestic energy production.”

    President George W. Bush (2006, 65.5%): “Breakthroughs…will help us reach another great goal: to replace more than 75 percent of our oil imports from the Middle East by 2025.”

    President Barack Obama (2009, 66.2%) “It will be the policy of my administration to reverse our dependence on foreign oil while building a new energy economy that will create millions of jobs.”

    See slides.

    Related: Oil Consumption by Country in 2007Google’s Energy InterestsSouth Korea To Invest $22 Billion in Overseas Energy Projects

  • Forum on the Future of Manufacturing in the US and Europe

    The Future of Manufacturing in the US and Europe, The German Marshall Fund. Speakers: Ron A. Bloom, Simon Fraser, Wilfried Porth and Philip Stephens. I must admit I didn’t find this to be the most useful webcast but for those interested it may be worth watching.

    Related: Manufacturing Driving USA RecoveryUSA Manufacturing Output Continues to Increase (over the long term)Manufacturing Output in Historically by USA, Europe and AsiaCapacity Utilization Rate Up Slightly From All Time Low (Aug 2009)

  • Is the Euro Going to Survive in the Long Run?

    To me, the prospects of a Euro currency surviving over the long term were not helped this week. The markets have behaved as though some great solutions have been adopted but it seems to me the fundamental problems if anything are worse now. It is true the short term is more stable. But at what cost?

    Bailout Is ‘Nail in the Coffin’ for Euro, Rogers Says

    The 16-nation currency weakened for a second day against the dollar after rallying as much as 2.7 percent on May 10, when the governments of the 16 euro nations agreed to make loans of as much as 750 billion euros ($962 billion) available to countries under attack from speculators and the European Central Bank pledged to intervene in government securities markets.

    “I was stunned,” Rogers, chairman of Rogers Holdings, said in a Bloomberg Television interview in Singapore. “This means that they’ve given up on the euro, they don’t particularly care if they have a sound currency, you have all these countries spending money they don’t have and it’s now going to continue.”

    “It’s a political currency and nobody is minding the economics behind the necessities to have a strong currency,” Rogers said. “I’m afraid it’s going to dissolve. They’re throwing more money at the problem and it’s going to make things worse down the road.”

    This makes sense to me. The problems with the Euro also explain why the dollar hasn’t fallen more over the last few years. The only significant alternative is the Yen. The BRIC countries (Brazil, Russia, India and China) are looking to increase the profile of their currencies supposedly – or even forming their version of the Euro (I can’t see how that could happen).

    Greece’s budget deficit of 13.6 percent of gross domestic product is the second-highest in the euro zone after Ireland’s 14.3 percent. As part of the bailout plan, Spain and Portugal also pledged deeper deficit reductions than previously planned.

    [Rogers suggests] Investors should instead buy precious metals including gold or currencies of countries that have large natural resources, Rogers said. Among other asset classes, he favors agricultural commodities as the best bet for the next decade as well as silver because prices haven’t rallied.

    It is very difficult for the politicians in the USA, United Kingdom and other countries to behave fiscally responsible when their taxpayers will eventually have to pay the bill. When you can hope to have others bail you out it seems that much less likely people will behave responsibly. Then again I was skeptical the Euro would be created without first having more consolidation of European governments. There are lots of good things about having the Euro, but in the long run there are very challenging issues to deal with.

    Related: Jim Rogers on the Financial Market MessWhy the Dollar is FallingA Bull on China

  • Bond Rates Remain Low, Little Change in Last 6 Months

    chart showing corporate and government bond yields
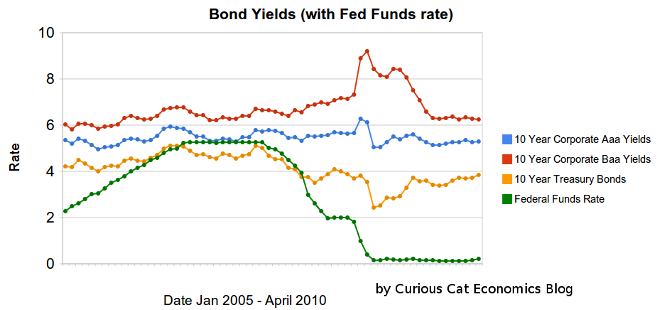
Chart showing corporate and government bond yields from 2005-2010 by Curious Cat Investing Economics Blog, Creative Commons Attribution, data from the Federal Reserve.

    Bond yields have remained low, with little change over the last 6 months. 10 year Aaa corporate bonds yields have increase 10 basis points to 5.29%. 10 year Baa yields have decreased 7 basis points to 6.25%. 10 year USA treasury bonds have increased 45 basis points (largely the effective of money scared into the safety of US treasuries leaving as the credit crisis eased. The federal funds rate remains under .25%.

    The United States economy appears to be gaining strength and if job growth can continue the Fed will likely reduce the amount giveaways to the banks by increasing the fed funds rate (though when this will happen is still very hard to judge). The Fed will also likely sell mortgages back to the market which will increase long term rates. The Fed will likely start by changing the wording that the economic conditions “are likely to warrant exceptionally low levels of the federal funds rate for an extended period.” When this language changes rates may well go up 25 to 50 basis points quickly.

    Related: Bond Yields Change Little Over Previous Months (December 2009)Chart Shows Wild Swings in Bond Yields in Late 2008Real Estate and Consumer Loan Delinquency Rates 1998-2009Government Debt as Percentage of GDP 1990-2008 in OECD: USA, Japan, Germany…