Category: quote

  • Capitalism from the Ground Up

    Peet’s Coffee: In Africa, Brewing Good Works by Steve Hamm

    But over the past year, Moayyad has taken on a new type of challenge. Peet’s has joined an effort to develop a vibrant coffee industry in sub-Saharan Africa. The Coffee Initiative, as it’s called, is run by TechnoServe, a nonprofit, and funded by the Bill & Melinda Gates Foundation. The goal: to double the income of poor coffee farmers in Kenya, Rwanda, Tanzania, and Uganda by linking their products with coffee lovers in the developed world.

    Because of bad roads and delays at border crossings, it took 12 days for a truck with a container full of green coffee beans to travel 1,000 miles to the Kenyan port of Mombasa. The sea journey from Mombasa took nearly two months. Worse, when the shipment arrived in Oakland, Calif., in late February, a portion of the coffee was slightly damaged.

    Moayyad traveled to Rwanda to cement relationships with farmer groups and gather stories about the farmers for use in marketing. With a videographer tagging along, she navigated molar-crunching roads in a four-wheel-drive pickup to remote villages and farms perched on hillsides high above Rwanda’s Lake Kivu. On the roadsides, children greeted the passing truck with an excited cry of “Abazungu [white people]!” Moayyad plans to post a journal of her travels on Peet’s Web site, aimed at the company’s most loyal customers, called Peetniks.

    A good effort. Real world issues confront you when you take steps to build the capacity for capitalism to help people live better lives. We need more such efforts to help capitalists make better lives for themselves around the world.

    Related: Bill Gates: Capitalism in the 21st CenturyInternational Development Fair, The Human FactorHelping Capitalism Create a Better WorldFrontline Explores Kiva in Uganda

  • 100th Entrepreneur Loan

    photo of Cesar Augusto Santamaría Escotophoto of Cesar Augusto Santamaría Escoto in his welding workshop, Chinandega, Nicaragua.

    I made my 100th contribution to a micro-loan through Kiva last week. Participating with Kiva is a great antidote to reading about the unethical “leaders” taking huge sums to run their companies into the ground (or even just taking obscene sums to maintain their company). The opportunity to give real capitalists an chance at a better life is wonderful.

    Kiva allows you to lend money to entrepreneur (in increments of $25). The most you get back is the amount you loaned, and if the entrepreneur, does not pay back the loan then you take a loss. This is something you do if you believe if giving people an opportunity to make a better life for themselves through hard work and intelligent economic choices.

    I encourage you to join me: let me know if you contribute to Kiva and I will add your Kiva page to our list of Curious Cat Kivans. Also join the Curious Cats Kiva Lending Team.

    My loans have been made to in 32 countries including: Ghana, Cambodia, Uganda, Viet Nam, Peru, Ukraine, Mongolia, Ecuador and Tajikistan. Kiva provides sector (but I think this data is a not that accurate – it depends on the Kiva partners that are not that accurate on identifying the sectors (it seems to me). A large number of the loans are in retail, clothing and food. I like making loans that will improve productivity (manufacturing, providing productivity enhancing services…) but can’t find as many of those as I would like (8% of my loans are in manufacturing, 11% agriculture, retail 18%, 23% food, 25% services (very questionable – these are normally really retail or food, it seems to me).

    Some examples of the entrepreneurs I have lent to: welding workshop (Nicaragua), expanding generator services business with computer services (Cambodia), food production (Ghana), manufacturing nylon (Nigeria), internet cafe (Lebanon), electronics repair (Benin), new engine for mill (Togo), weaving (Indonesia) and a food market (Mexico).

    Related: Financial ThanksgivingMicroFinance Currency RiskCreating a World Without PovertyProvide a Helping Hand

    21 of my loans have been paid back in full. 3 have defaulted. Those figure give a distorted picture though (I believe). There was a problem with a Kiva partner (they partner with micro-finance banks around the world) MIFEX, in Ecuador. Kiva discovered that MIFEX (i) improperly inflated the loan amounts it posted for entrepreneurs on the Kiva website and (ii) kept the excess amount of the posted loan to fund its own operational expenses. Kiva does not expect any further payments on these loans. I had 2, so I think those 2 give a fair impression. The 3rd default is from Kenya. That loan was to a business selling bicycle parts. In 2008, in Kenya, the prevailing political crisis deteriorated and businesses have either been destroyed or closed in fear of looters. Technically the loan did default, however, I was paid $71.50 out of $75 loan (so the defaulted amount was very small.
    (more…)

  • The Value of Home Ownership

    Home Ownership Shelter, or Burden?

    The collapse in house prices matters most directly to two overlapping groups: those who bought property at the peak of the market and now face “negative equity”; and those (in America) who took out subprime mortgages. Roughly 10m Americans are in negative equity—ie, the cost of their mortgage exceeds the value of their home. In Britain about 3% of households are in negative equity. For homeowners, negative equity makes houses more like a trap than a piggy bank. Those who cannot meet their payments lose their house, their savings and (in America, usually) their credit rating for seven years.

    The other area of concentrated distress is subprime mortgages, which increased their share of the American mortgage market from 7% in 2001 to over 20% in 2006. According to the Mortgage Bankers Association, the delinquency rate was 22% in the fourth quarter of 2008, compared with only 5% for prime loans.

    “Perhaps the most compelling argument for housing as a means of wealth accumulation”, argues Richard Green of the University of Southern California, “is that it gives households a default mechanism for savings.” Because people have to pay off a mortgage, they increase their home equity and save more than they otherwise would. This is indeed a strong argument: social-science research finds that people save more if they do so automatically rather than having to choose to set something aside every month.

    Yet there are other ways to create “default savings”, such as companies offering automatic deductions to retirement plans. In any case, some of the financial snake oil peddled at the height of the housing bubble was bad for saving.

    The debate over whether home ownership is a wise investment or not, is contentious (more so in the last year than it was several years ago). I believe in most cases it probably is wise, but there are certainly cases where it is not. If you put yourself in too much debt that is often a big problem. I also think you should save a down payment first. If you are going to move (or have good odds you may want to) then renting is often the better option.

    The “default saving” feature is one of the large benefits of home ownership. That benefit is destroyed when you take out loans against the rising value of the house. And in fact this can not just remove the benefit but turn into a negative. If you spend money you should have (increasing your debt) that can not only remove you default saving benefit but actual make your debt situation worse than if you never bought.

    Related: Your Home as an InvestmentNearly 10% of Mortgages Delinquent or in ForeclosureHousing Rents Falling in the USAIgnorance of Many Mortgage Holders

  • Continued Large Spreads Between Corporate and Government Bond Yields

    graph of 10 year Aaa, Baa and corporate bond rates from 2005-2009
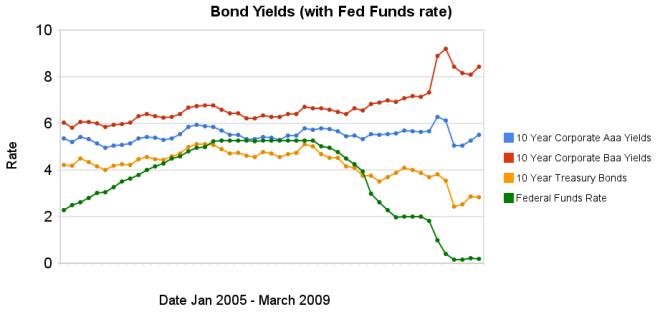
Chart showing corporate and government bond yields by Curious Cat Investing Economics Blog, Creative Commons Attribution, data from the Federal Reserve.

    The federal funds rate remains under .25%. The large spread between government bonds and corporate bonds remains very large. In the last 3 months the yields on Aaa corporate bonds have increased 45 basis points, Baa corporate bond yields have decreased 1 basis points, while treasury bond yields have increased 40 basis points.

    The spread between 10 year Aaa corporate bond yields and 10 year government bond yields is now 268 basis points. In January, 2008 the spread was 159 points. The larger the spread the more people demand in interest, to compensate for the increased risk. The spread between government bonds and Baa corporate bonds decreased to a still very large 566 basis points, the spread was 280 basis point in January 2008, and 362 basis points in September 2008.

    Data from the federal reserve: corporate Aaacorporate Baaten year treasuryfed funds

    Related: Chart Shows Wild Swings in Bond YieldsFed to Start Buying Treasury Bonds TodayCorporate and Government Bond Rates Graph (Oct 2008)investing and economic charts

  • Tax Considerations with Mutual Fund Investments

    One problem with investing in mutual funds is potential tax bills. If the fund has invested well and say bought Google at $150 and then Google was at $700 (a few years ago) there is the potential tax liability of the $550 gain per share. So if funds have been successful (which is one reason you may want to invest in them) they often have had a large potential tax liability.

    With an open end mutual fund the price is calculated each day based on the net asset value, which is fair but really the true value if there is a large potential tax liability is less than if there was none. So in reality you had to believe the management would outperform enough to make up for the extra taxes that would be owed.

    Well, the drastic stock market decline over the last few years has turned this upside down and many mutual funds actual have tax losses that they have realized (which can be used to offset future capital gains). Say the fund had realized capital losses of $30,000,000 last year. Then if they have capital gains of $20,000,000 next year they can use the losses from last year and will not report any taxable capital gains. And the next year the first $10,000,000 in capital gains would be not table either. Business Week, had an article on this recently – Big Losers Can Be Big Tax Shelters

    Take Dodge & Cox International. It has a -80% capital-gains exposure, meaning it has a capital loss that covers 80% of assets. So it could have several years of tax-free gains.

    Yet it is Miller’s newer charge, Legg Mason Opportunity, which holds stocks of all sizes and can take short positions, that will prove to be the real tax haven. Morningstar pegs its losses at 285% of its $1.2 billion in assets.

    There are other funds with returns so ugly and losses so large that it may not matter what their trading style is for many years: Fidelity Select Electronics (FSELX), -539%; MFS Core Equity A, -369%; Janus Worldwide (JAWWX), -304%; Vanguard U.S. Growth (VWUSX), -227%.

    How does a fund have over 100% tax losses? The way I can think of is if they have a great deal of redemptions. If the fund shrinks in size from a $3 billion fund to a $300 million fund they could have a 50% realized capital loss (down to $750 million) but then another $450 million in redemptions). Now the $300 million has a $750 million capital loss or 250%.

    Related: Shorting Using Inverse FundsLazy Portfolio ResultsDoes a Declining Stock Market Worry You?Asset Allocations Make A Big Difference

  • Another 663,000 Jobs Lost in March in the USA

    663,000 jobs were lost in the USA in March and the unemployment rate rose from 8.1 to 8.5 percent, the Bureau of Labor Statistics of the U.S. Department of Labor reported today. Since the recession began in December 2007, 5.1 million jobs have been lost, with almost two-thirds (3.3 million) of the decrease occurring in the last 5 months. In March, job losses were large and widespread across the major industry sectors.

    In March, the number of unemployed persons increased by 694,000 to 13.2 million, and the unemployment rate rose to 8.5 percent. Why is that different than the numbers above? The numbers are from different sources of data, the first from BLS surveys of businesses and the 694,000 from household surveys. This reminds us that this data is approximate, not exact. Undoubtedly the figures will be revised as more data is analyzed.

    Over the past 12 months, the number of unemployed persons has grown by about 5.3 million, and the unemployment rate has risen by 3.4 percentage points. Half of the increase in both the number of unemployed and the unemployment rate occurred in the last 4 months.

    The unemployment rates continued to trend upward in March for adult men, 8.8%, adult women 7.0%, whites 7.9% and Hispanics 11.4%. The jobless rates for African Americans, 13.3% and teenagers 21.7% were little changed over the month. The unemployment rate for Asians was 6.4% in March, not seasonally adjusted, up from 3.6% a year earlier.

    Related: Over 500,000 Jobs Disappeared in NovemberManufacturing Employment Data – 1979 to 2007What Do Unemployment Stats Mean?

  • Government Debt as a Percentage of GDP

    Government debt as percent of GDPChart showing government debt as a percentage of GDP by Curious Cat Investing Economics Blog, Creative Commons Attribution, data from OECD, March 2009.

    The USA federal government debt is far too large, in my opinion. We have been raising taxes on future taxpayers for several decades, to finance our current spending. Within reason deficit spending is fine. What that reasonable level is however, is not easy to know. One big problem with the past few decades is that during very prosperous economic times we spent money that we didn’t have, choosing to raise taxes on the future (instead of either not spending as much or paying for what we were spending by raising taxes to pay for current spending).

    By not even paying for what we are spending when times were prosperous we put ourselves in a bad situation when we have poor economic conditions – like today. If we were responsible during good economic times (and at least paid for what we spent) we could have reduced our debt as a percentage of GDP. Even if we did not pay down debt, just by not increasing the outstanding debt while the economy grew the ratio of debt to GDP would decline. Then when times were bad, we could afford to run deficits and perhaps bring the debt level up to some reasonable level (maybe 40% of GDP – though it is hard to know what the target should be, 40% seems within the realm of reason to me, for now).

    There is at least one more point to remember, the figures in the chart are based on reported debt. The USA has huge liabilities that are not accounted for. So you must remember that the actually debt is much higher than reported in the official debt calculation.

    Now on to the good news. As bad as the USA has been at spending tomorrows increases in taxes today, compared to the OECD countries we are actually better than average. The OECD is made up of countries in Europe, the USA, Japan, Korea, Australia, New Zealand and Canada. The chart shows the percentage of GDP that government debt represents for various countries. The USA ended 2006 at 62% while the overall OECD total is 77%. In 1990 the USA was at 63% and the OECD was at 57%. Japan is the line way at the top with a 2006 total of 180% (that is a big problem for them). Korea is in the best shape at just a 28% total in 2006 but that is an increase from just 8% in 1990.

    Related: Federal Deficit To Double This YearPoliticians Again Raising Taxes On Your ChildrenTrue Level of USA Federal DeficitWho Will Buy All the USA’s Debt?Top 12 Manufacturing Countries in 2007Oil Consumption by Country
    (more…)

  • Data Shows Subprime Mortgages Were Failing Years Before the Crisis Hit

    Here is a very interesting paper showing real analysis of the data to illustrate that the deteriorating condition of loans should have been caught by those financing such loans years before the mortgage crisis erupted. Understanding the Subprime Mortgage Crisis by Yuliya Demyanyk, Federal Reserve Bank of Cleveland and Otto Van Hemert, New York University.

    Using loan-level data, we analyze the quality of subprime mortgage loans by adjusting their performance for differences in borrower characteristics, loan characteristics, and macroeconomic conditions. We find that the quality of loans deteriorated for six consecutive years before the crisis and that securitizers were, to some extent, aware of it. We provide evidence that the rise and fall of the subprime mortgage market follows a classic lending boom-bust scenario, in which unsustainable growth leads to the collapse of the market. Problems could have been detected long before the crisis, but they were masked by high house price appreciation between 2003 and 2005.

    In many respects, the subprime market experienced a classic lending boom-bust scenario with rapid market growth, loosening underwriting standards, deteriorating loan performance, and decreasing risk premiums.30 Argentina in 1980, Chile in 1982, Sweden, Norway, and Finland in 1992, Mexico in 1994, Thailand, Indonesia, and Korea in 1997 all experienced the culmination of a boom-bust scenario, albeit in different economic settings.
    Were problems in the subprime mortgage market apparent before the actual crisis erupted in 2007? Our answer is yes, at least by the end of 2005. Using the data available only at the end of 2005, we show that the monotonic degradation of the subprime market was already apparent. Loan quality had been worsening for five years in a row at that point. Rapid appreciation in housing prices masked the deterioration in the subprime mortgage market and thus the true riskiness of subprime mortgage loans. When housing prices stopped climbing, the risk in the market became apparent.

    Related: Nearly 10% of Mortgages Delinquent or in ForeclosureHow Much Worse Can the Mortgage Crisis Get?Homes Entering Foreclosure at RecordArticles on Real Estate

  • USA Spent $2.2 Trillion, 16.2% of GDP, on Health Care in 2007

    Health spending in the United States grew 6.1 percent in 2007, to $2.2 trillion or $7,421 per person.
    For comparison the total GDP per person in China is $6,100. This continues the trend of health care spending taking an every increasing portion of the economic output (the economy grew by 4.8 percent in 2007). This brings health care spending to 16.2% of GDP (which is yet another, in a string of record high percentages of GDP spent on health care). In 2003 the total health care spending was 15.3 of GDP.

    With the exception of prescription drugs (which grew at 1.4% in 2007, compared to the 3.5% in 2006), spending for most other health care services grew at about the same rate or faster than in 2006. Hospital spending, which accounts for about 30 percent of total health care spending, grew 7.3 percent in 2007, compared to 6.9 percent in 2006.

    Spending growth for both nursing home and home health services accelerated in 2007 (4.8% v. 4.0%). Spending growth for freestanding home health care services increased to 11.3 percent. Total health care spending by public programs, such as Medicare and Medicaid, grew 6.4% in 2007 v. 8.2% in 2006. In comparison, health care spending by private sources grew 5.8% compared to 5.4%.

    Private health insurance premiums grew 6.0 percent in 2007, the same rate as in 2006. Out-of-pocket spending grew 5.3 percent in 2007, an acceleration from 3.3 percent growth in 2006. Out-of-pocket spending accounted for 12.0 percent of national health spending in 2007. This share has been steadily declining both recently and over the long-run; in 1998, it accounted for 14.7 percent of health spending and, in 1968, out-of-pocket spending accounted for 34.8 percent of all health spending.

    The costs for health services and supplies for 2007 were distributed among businesses (25%), households (31%), other private sponsors (4%), and governments (40%).

    Decades ago Dr. Deming included excessive health care costs as one of the seven deadly diseases of western management. We have only seen the problem get worse. Finally it seems that a significant number of people are in agreement that the system is broken. Still, admitting the system is broken is not the same as agreeing on how to fix it. The way forward to workable solutions still seems very difficult.

    Full press release from the United States Department of Health and Human Services.

    Related: International Health Care System PerformancePersonal Finance Basics: Health InsuranceMany Experts Say Health-Care System Inefficient, WastefulHow to Improve the Health Care System

  • Credit Crisis the Result of Planned Looting of the World Economy

    Fluke? Credit crisis was a heist by James Jubak

    What we’re now living through, though, is the result of a conscious, planned looting of the world economy. Its roots stretch back decades. And it wouldn’t have been possible without the contrivances of the bought-and-paid-for folks who sit in Congress.

    Of course, just because the plan blew up on the looters, taking off a financial finger here and a portfolio hand there, you shouldn’t have any illusion that they’ve retired. In fact, in the “solutions” now being proposed — by Congress — to fix the global and U.S. financial systems, you can see the looters at work as hard as ever.

    He is exactly right.

    Question: Why weren’t state insurance regulators more aggressive in regulating AIG?

    Answer: Because the federal government had forced them to back off. An aggressive interpretation of the definition of insurance could have let state insurance agencies regulate the derivatives contracts that AIG’s financial-products group was writing out of London. These were, in fact, insurance policies that guaranteed the companies taking them out (banks, other insurance companies, investment banks and the like) against losses on securities in their portfolios.

    But Congress had made it very clear in the Commodity Futures Modernization Act — supported by then-Federal Reserve Chairman Alan Greenspan, steered through Congress by then-Sen. Phil Gramm, R-Texas, and signed into law by President Bill Clinton in December 2000 — that most over-the-counter derivatives contracts were outside the regulatory purview of all federal agencies, even the Commodity Futures Trading Commission.

    With the new law on the books, the market for credit default swaps exploded from $632 billion outstanding in the first half of 2001, according to the International Swaps and Derivatives Association, to $62 trillion in the second half of 2007.

    Question: Wasn’t anybody worried about the risk to the financial system posed by a market that dwarfed the assets of the sellers of this insurance?

    Answer: Worry about leverage? You’ve got to be kidding.

    In 2004, the Securities and Exchange Commission, after hard lobbying by Wall Street, reversed its 1975 rule limiting investment banks to leverage of 15-to-1. The new limit could be as high as 40-to-1 if the investment banks’ own computer models said it was safe.

    Understanding the people paid lots of money to politicians and then (after they got lots of money) those politicians enacted laws that endangered the economy to favor those giving them lots of money. Now maybe these politicians just like letting exceptionally wealthy people endanger the economy for personal gain. Maybe they think that is a good idea. I tend to think instead they do what those they give them lots of money want. But maybe I am wrong on that.
    (more…)