Category: quote

  • Data on the Largest Manufacturing Countries in 2008

    Manufacturing is an powerful driver of economic wealth. For years I have been providing data to counter the contention that the manufacturing base of the USA is gone and the little bit left was shrinking. The latest data again shows the USA is the largest manufacturer, and manufacturing in the USA continues to grow. It is true global manufacturing has begun to grow more rapidly than USA manufacturing in the last few years. I doubt many suspect that the USA’s share of manufacturing stayed stable from 1990 to 1995 then grew to 2000 took until 2006 to return to the 1990-1995 levels and then has declined in 2007 and 2008 a bit below the 1990 level and during that entire time was growing (even in 2007 and 2008).

    The USA’s share of the manufacturing output, of the countries that manufactured over $185 billion in 2008, 28% in 1990, 28% in 1995, 32% in 2000, 28% in 2005, 28% in 2006, 26% in 2007 and 24% in 2008. China’s share has grown from 4% in 1990, 6% in 1995, 10% in 2000, 13% in 2005, 14% in 2006, 16% in 2007 to 18% in 2008. Japan’s share has fallen from 22% in 1990 to 14% in 2008 (after increasing to 26% in 1995 then steadily falling). The USA has about 4.5% of the world population, China about 20%.

    Based on the latest UN Data, for global manufacturing, in billions of current US dollars:

    Country 1990 1995 2000 2005 2006 2007 2008
    USA 1,041 1,289 1,543 1,624 1,712 1,756 1,831
    China 145 300 484 734* 891* 1,106* 1,399**
    Japan 810 1,219 1,034 979 927 923 1,045
    Germany 438 517 392 571 608 711 767
    Italy 240 226 206 295 302 345 381
    United Kingdom 206 218 226 264 295 323 323
    France 200 233 190 255 255 287 306
    Russian Federation 120 64 45 124 157 206 256
    Brazil 120 125 96 137 163 201 237
    Korea 66 131 136 211 234 260 231
    Spain 112 104 98 160 170 196 222
    Mexico 62 67 133 154 175 182 197
    Canada 92 100 129 168 182 197 195
    India 51 61 69 122 141 177 188

    * I am using the data from last year that separated the manufacturing data (this year the data does not provide separate manufacturing data for China) instead of that shown in the most recent data (which doesn’t separate manufacturing)
    ** The China data is not provided for manufacturing alone. The percentage of manufacturing (to manufacturing, mining and utilities) was 78% for 2005-2007 (I used 78% of the manufacturing, mining and utilities figure provided in the 2008 data).

    I hope to write a series of posts examining global manufacturing data including looking at manufacturing data specifically (excluding mining and utility data).
    (more…)

  • Nouriel Roubini Believes Stock Market has Risen too Far, too Fast

    Nouriel Roubini is still worried about the US economy, though he does believe we are coming to the end of the severe recession we have been in.

    I believe, that if you were worried about your portfolio being overweighted in stocks late last year, now is a good time to move some money out of the stock market. In December 2008, when many were selling in panic, I invested more in stocks.

    The stock market has been on a tear increasing

    1 December 2008 the S&P 500 was at 816
    1 January 2009 – 903
    6 March 2009 – 684 (the lowest point since 1996)
    1 May 2009 – 878
    1 August 2009 – 987
    5 October 2009 – 1040

    In 6 months, since the market hit a low on March 6th, it is up 52%. Certainly the decrease in prices seemed overdone. The 50% increase in prices seems overdone also. But trying to predict short term moves in the stock market (say under 1 year) is very difficult and few people can do so successfully (even if you can find lots of people offering their guesses). Predicting the economy, while not easy, is much much easier that predicting the stock market.
    (more…)

  • It is Never to Late to Invest

    I like to buy stocks cheap and then hold them as they rise in price. This is not a unique desire, I know. One thing this lead me to do was find a stock I liked but hold off buying it until I could buy it for less. When that works it is great. However, one thing that happened several times is that I found stocks I really liked and they just went up and went up more and kept going up. And I never owned them.

    I learned, after awhile, that is was ok to buy a stock at a higher price once I realized I made a mistake. Instead of just missing out because I made a mistake and didn’t buy it at a lower price than I needed to pay today (which made it feel really lame to buy it now at a higher price) I learned to accept that buying at the higher price available today was the best option.

    I have seen two types of situations where this takes place: one I realize I was just way off, it was a great deal at the price I could have bought at – I just made a mistake. And if it was still a good buy, I should buy it. Another is that the stock price goes up but new news more than makes up for the increased stock price (the news makes the value of stock increase more than the price has increased).

    I missed out on the Google IPO, even though I really wanted to buy. Then the price went way up and even though I had learned this (don’t avoid buying a stock today just because you made the mistake of not buying it at a lower price earlier) tip I wanted to buy it for less than the current price and so kept not buying it (emotion is a real factor in investing and that is another thing I have realized – you need to accept it and deal with it to be a good investor). Then Google announced spectacular earnings and it was finally enough to get me to buy the stock a few days later at $219 (which was well over twice the price 6 months earlier). But it was a great buy at $219 and losing that just because I should have bought it at $119 is not wise – but something I did many times in the past.

    In March of 2009 I bought some ATPG at $3.20. In August I bought more at $11. The news was bit better but really it was just a huge huge bargain at $3.20 and I should have bought a lot more. In the last 5 trading days ATPG was up $5.12 (16.78 – 11.66). A nice gain. Right now, it is up another 68 cents today at $17.43. Now this is a volatile stock and until I sell it may not turn out to be profitable investment, but the odds are good that it will.

    It is also hard to know when to sell – in fact for many selling at the wrong time (either selling too late – after it collapses [for good or sell it after a collapse only to see it recover], or too early missing out on huge gains) is the biggest problem they have in becoming a successful investor). One trait of many successful investors is holding the right investments for huge gains. A few stellar performances can lift the entire portfolio to long term investing success. And if you sell those stocks early you miss huge opportunities.

    Holding on for the huge gains is a mistake I do not want to make – and so when the opportunity is there for such gains I am willing to risk losing some gains for the potential of a much larger gain. Right now the balance is keeping me from selling any ATPG, though I am likely to sell some if it increases (while continuing to hold some of the position).

    Related: Great Google Earnings April 2007Nicolas Darvas (investor and speculator)Not Every Day is ProfitableDoes a Declining Stock Market Worry You?401(k)s are a Great Way to Save for RetirementBeating the Market, Suckers Game?Sleep Well Fund

  • Consumer Debt Declined a Record $21.5 Billion in July

    Last November USA consumer debt fell, by a then record of $8 billion. In July, 2009, consumer debt was reduced another $21 billion, which is a good sign.

    April of 2008 USA consumer debt stood at $2.54 trillion. Based on a population of 300 million people that would mean $8,467 for every person in just personal debt. Living beyond your means is not a good thing. After the July decrease of $21.55 billion, the total consumer debt stood at $2.47 trillion, a decline of $70 billion over the last 15 months.

    Decreasing this debt level was (and is) necessary. If that means we have some suffering today to pay for living beyond our means for years the ‘fix’ is not to continue to live beyond our means. The ‘fix’ is to accept the consequences of past behavior and build a more sustainable economy now for the future.

    Consumer credit down record amount in July

    This is the sixth straight monthly drop in consumer credit — the longest consecutive string of declines in credit since the second half of 1991.

    Consumers have retrenched since the financial crisis hit in full force last September. Credit has fallen in every month except January. In percentage terms, the drop in credit is the biggest since June 1975.

    And on a year-on-year basis, credit is down 4.3%, the biggest drop since June 1944. The retrenchment was much more than expected. Economists surveyed by MarketWatch expected consumer credit to decline by $4.3 billion. There were also sharp downward revisions to June data.

    Economists said shrinking credit might strangle the recovery. “There is no real way to put a positive spin on these data. Credit is still shrinking and that is going to have an impact on consumption,” wrote Charmaine Buskas, senior economics strategist at TD Securities, in a note to clients.

    credit-card debt fell $6.11 billion, or 8.5%, in July to $905.58 billion. This is the record 11th straight monthly drop in credit card debt. Non-revolving credit, such as auto loans, personal loans and student loans fell a record $15.44 billion or 11.7% to $1.57 trillion.

    Here is a positive spin on it. We owe $21.5 billion less than we did last month. How lost are we that there is no positive way to spin owing less money than you used to owe?

    Related: Personal Saving and Personal Debt in the USAAmericans are Drowning in Debt

  • Government Debt Compared to GDP 1990-2007

    Government debt as percent of GDP 1990-2007Chart showing government debt as a percentage of GDP by Curious Cat Investing Economics Blog, Creative Commons Attribution, data from OECD, Sept 2009.
                    

    For 2007 most countries slightly decreased their government debt to GDP ratio – as economic growth exceeded debt growth. The OECD is made up of countries in Europe and the USA, Japan, Korea, Australia, New Zealand and Canada. The overall OECD debt to GDP ratio decreased from 77% in 2005 to 75% in 2007. The USA moved in the opposite direction increasing from 62% to 63%: still remaining far below the OECD total. Most likely 2008, 2009 and 2010 will see both the USA and other OECD national dramatically increase the debt burden.

    Compared to the OECD countries the USA is actually better than average. The chart shows the percentage of GDP that government debt represents for various countries. The USA ended 2007 at 63% while the overall OECD total is 75%. In 1990 the USA was at 63% and the OECD was at 57%. Japan is the line way at the top with a 2007 total of 171% (that is a big problem for them). Korea is in the best shape at just a 29% total in 2007 but that is an increase from just 8% in 1990.

    Related: Government Debt as a Percentage of GDP Through 2006Oil Consumption by Country in 2007Federal Deficit To Double This YearPoliticians Again Raising Taxes On Your ChildrenTrue Level of USA Federal DeficitTop 12 Manufacturing Countries in 2007
    (more…)

  • Oil Consumption by Country in 2007

    The largest oil consuming countries (and EU), in millions of barrels per day for 2007. China increased use by 1 billion barrels a day, the USA and Europe decreased use by 100 million barrels a day from our post last year on Oil Consumption by Country.

    Country consumption % of oil used % of population % of World GDP % of oil used in 2006
    USA 20.7 24.3 4.5 21.0 25.9
    European Union 14.4 16.9 7.4 21.9 18.1
    China 7.9 9.2 19.9 10.8 8.6
    Japan 5.0 5.8 1.8 6.5 6.7
    India 2.7 3.1 17.3 4.5 3.0
    Russia 2.7 3.1 2.0 3.1 3.6
    Germany 2.5 2.8 1.2 4.2 3.3
    Brazil 2.4 2.7 2.9 2.8 2.6
    Canada 2.4 2.7 0.4 1.9 2.9
    Mexico 2.1 2.4 1.6 2.0 2.6
    South Korea 2.1 2.4 0.7 1.8 2.7

    Data is from CIA World Factbook 2009 (downloaded August 2009). GDP calculated using purchasing power parity from 2008 fact book with estimated 2007 data.

    Related: Government Debt as a Percentage of GDPGlobal Manufacturing Production by CountryManufacturing Contracting Globally (March 2009)

  • Capacity Utilization Rate Up Slightly From All Time Low

    chart of USA capacity utilization rate 1972-2009
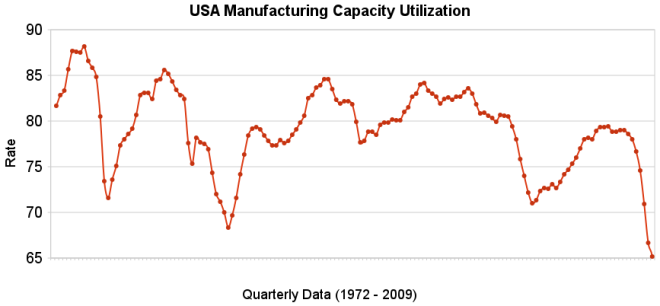
The chart shows the capacity utilization rate in the USA. By Curious Cat Investing Economics Blog, Creative Commons Attribution, data from the Federal Reserve.

    Industrial production increased .5% in July and capacity utilization rate increased to 68.5% from an all time low of 68.1%. Capacity utilization has averaged 80.9% from 1972 to today.

    Manufacturing output increased 1.0% in July but remained 14.4% lower than its year-earlier level. The factory operating rate rose to 65.4% in July, 70 basis points above the historical low recorded in June; the series begins in 1948. Production in durable goods industries advanced 2.2% in July. In addition to the sharp increase in motor vehicles and parts output, large production gains occurred for nonmetallic mineral products and for primary metals. The indexes for wood products, computer and electronic products, aerospace and miscellaneous transportation equipment, furniture and related products, and miscellaneous goods also rose. The indexes for fabricated metal products, machinery, and electrical equipment declined.

    The production of nondurable goods fell 0.1% in July. The indexes for textile and product mills and for printing and support recorded sizable declines; the indexes for food, beverages, and tobacco and for petroleum and coal products also declined. The output of paper, of chemicals, and of plastic and rubber products increased.

    The index for other manufacturing, which consists of publishing and logging, was down 0.6% in July.

    The output of electric and gas utilities decreased 2.4%, and the operating rate for utilities dropped 21 basis points, to 77.6%. Mining production moved up 0.8%; its utilization rate in July, at 81.7%, was 59 basis points below its 1972-2008 average.

    Data from the St. Louis Federal Reserve and Federal Reserve August 14th Industrial Production and Capacity Utilization press release.

    Related: Loan Default Rates: 1998-2009Government Debt as a Percentage of GDPUSA Spent $2.2 Trillion, 16.2% of GDP, on Health Care in 2007
    (more…)

  • Bond Yields Show Dramatic Increase in Investor Confidence

    graph of 10 year Aaa, Baa and corporate bond rates from 2005-2009
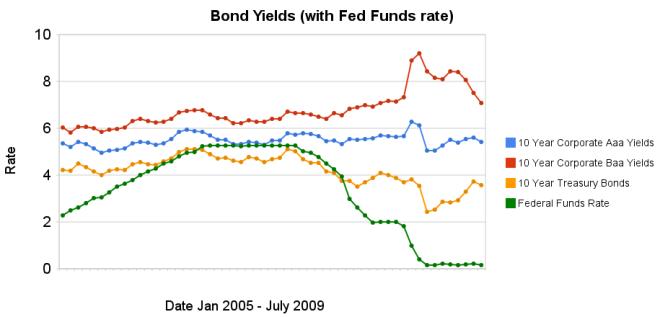
Chart showing corporate and government bond yields by Curious Cat Investing Economics Blog, Creative Commons Attribution, data from the Federal Reserve.

    The changes in bond yields over the last 3 months months indicate a huge increase in investor confidence. The yield spread between corporate Baa 10 year bonds and 10 year treasury bonds increased 304 basis points from July 2008 to December 2008, indicating a huge swing in investor sentiment away from risk and to security (US government securities). From April 2009 to July 2009 the yield spread decreased by 213 basis points showing investors have moved away from government bonds and into Baa corporate bonds.

    From April to July 10 year corporate Aaa yields have stayed essentially unchanged (5.39% to 5.41% in July). Baa yields plunged from 8.39% to 7.09%. And 10 year government bond yields increased from 2.93% to 3.56%. federal funds rate remains under .25%.

    Investors are now willing to take risk on corporate defaults for a much lower premium (over government bond yields) than just a few months ago. This is a sign the credit crisis has eased quite dramatically, even though it is not yet over.

    Data from the federal reserve: corporate Aaacorporate Baaten year treasuryfed funds

    Related: Continued Large Spreads Between Corporate and Government Bond Yields (April 2009)Chart Shows Wild Swings in Bond Yields (Jan 2009)investing and economic charts

  • Lazy Portfolios Seven-year Winning Streak

    Here is an excellent article on how to invest in the stock market. I personally tweak this advice a bit but it is much better than most advice you get. Basically keep costs down (don’t pay large fees) and diversify. Lazy Portfolios seven-year winning streak by Paul Farrell

    Greed drives this [mutual fund] industry. The “world’s largest skimming operation” has now lost over 50% of America’s savings in the decade since the peak of 2000. The track record of actively managed funds during the recent subprime-credit meltdown continues to prove that the industry is failing America. The only way to invest is with index funds, which make up just 14% of the total.

    In short, even though we know that the average compensation of portfolio managers is often $400,000 to more than a $1 million, the hot-shot managers of these actively managed funds provided no value-added to their funds’ performance. Conclusion: Their investors would be better off investing in index funds.

    Yes, the market was in negative territory the past few years, but still all eight Lazy Portfolios outperformed each of the six actively-managed funds.

    Customize your own Lazy Portfolio following these six rules and you’ll win. More important, you’ll have lots of time left to enjoy what really counts, your family, friends, career, sports, hobbies, living.

    2) Frugality, savings versus financial obesity. Tools like starting early, autopilot saving plans, dollar-cost averaging, frugal living and other tricks are familiar to long-term investors. Trust your frugality instincts — living below your means — it’s a trait common among America’s “millionaires next door.”

    Related: Lazy Portfolio Results (April 2008)Allocations Make A Big Difference12 stocks for 10 years401(k)s are a Great Way to Save for Retirement

  • 12 Stocks for 10 Years – July 2009 Update

    I originally setup the 10 stocks for 10 years portfolio in April of 2005. In order to track performance created a marketocracy portfolio but had to make some minor adjustments (and marketocracy doesn’t allow Tesco to be purchased, though it is easily available as an ADR to anyone in the USA to buy in real life – it is based in England). The current marketocracy calculated annualized rate or return (which excludes Tesco) is 3.5% (the S&P 500 annualized return for the period is -1.7%) – marketocracy subtracts the equivalent of 2% of assets annually to simulate management fees – as though the portfolio were a mutual fund – so without that the return is about 5.5%).

    The current stocks, in order of return:

    Stock Current Return % of sleep well portfolio now % of the portfolio if I were buying today
    Amazon – AMZN 136% 9% 9%
    Google – GOOG 105% 15% 13%
    Templeton Dragon Fund – TDF 80% 11% 11%
    PetroChina – PTR 78% 11% 10%
    Templeton Emerging Market Fund – EMF 28% 5% 6%
    Cisco – CSCO 15% 6% 8%
    Toyota – TM 7% 9% 11%
    Danaher – DHR -14% 6% 9%
    Tesco – TSCDY -14%* 0%* 10%
    Intel – INTC -15% 4% 6%
    Pfizer – PFE -38% 5% 7%
    Dell -60% 4% 0%

    The portfolio is beating the S&P 500 by 5.2% annually (which is actually quite good. Also it is a bit confused due to to Tesco not being included. View the current marketocracy Sleep Well portfolio page.

    Related: 12 Stocks for 10 Years Update – June 2008posts on stocksinvesting books
    (more…)