Tag: China

  • Top 15 Manufacturing Countries in 2009

    China continues to grow manufacturing is output. In 2009, the USA, and most countries saw declines in manufacturing production. China, however, continued to grow. China is now finally approaching the level of manufacturing done in USA. The latest data again shows the USA is the largest manufacturer but China looks poised to take over the number one spot soon.

    chart of manufacturing production by leading manufacturing countries
    The chart showing manufacturing output by country was created by the Curious Cat Economics Blog based on UN data (in 2009 USA dollars). You may use the chart with attribution.

    The large decline in Germany was 23%. This was a 18% decline in Euro terms, and when you added the decline of the Euro the total USA dollar decline was 23%. Quite extraordinary. Most European countries were down over 15%. In fact, so extraordinary it makes me question the data. World economic data is useful and interesting but it isn’t perfect. USA manufacturing declined just .5%. China increased manufacturing production by 9%.

    The last 2 years, China has stopped separating out mining and utilities from manufacturing. The percentage of manufacturing (to manufacturing, mining and utilities) was 78% for 2005-2007 (I used 78% of the manufacturing, mining and utilities figure provided in the 2008 and 2009 data – but that could be wrong). The unadjusted 2009 China total was $2.05 trillion and for the USA the total manufacturing, mining and utilities was $2.33 trillion. In 2009, the manufacturing total was 76% of USA manufacturing, mining and utilities. The percentage varies significantly between countries (the Russian federation is about 55% and Japan about 91%) and various over time as a countries economy changes.

    The big, long term story remains the same. China has continued to grow manufacturing output tremendously. I see very little data to support the stories about manufacturing having to leave China to go elsewhere (especially when you look at the “lower wages” counties mentioned in news stories – they are not growing at any significant rate). The USA is still manufacturing a huge amount and that production has steadily grown over time.

    When you look back over the period from 1980 to today you can see

    1. The biggest story is the growth in Chinese manufacturing
    2. The USA started out the largest and has grown significantly
    3. Japan did very well from 1980 to 1995, and since they have struggled
    4. The USA, China, Japan are really far ahead of other countries in total manufacturing output, and Germany is solidly in 4th place.
    5. After that the countries are fairly closely grouped together. Though there are significant trends hidden by the scale of this graph, which I will explore in future posts. South Korea has growth significantly over this period, for example.
    6. The biggest macro trend that the data shows, but is not so visible in this chart (other than China’s growth), is the very strong performance of emerging markets (and in fact some counties have fully become manufacturing powerhouses during this period, most notably China but also, South Korea and Brazil). And I see that continuing going forward (though that is speculation).

    Two more interesting pieces of data. Italy is the 5th largest manufacturing country, I don’t think many people would guess that. Since 1980 Italy surpassed the UK and France but China rocketed passed them. And Indonesia has moved into 14th place, edging out Canada in 2009.

    I plan to take more time in 2011 to look at global manufacturing and other global economic data more closely and to write about it here.

    Related: Data on the Largest Manufacturing Countries in 2008Top 12 Manufacturing Countries in 2007Top 10 Manufacturing Countries 2006Leading global manufacturers in 2004

  • Government Debt as Percentage of GDP 1990-2009: USA, Japan, Germany, China…

    The world today has a much different economic landscape than just 20 years ago. China’s amazing economic growth is likely the biggest story. But the overwhelming success of many other countries is also a huge story. Today it is not the developing world that has governments spending taxes they promise their grandchildren will pay, but instead the richest countries on earth that choose to spend today and pay tomorrow. While “developing” countries have well balanced government budgets overall.

    graph showing government debt as percentage of GDPThe chart shows gross government debt as percentage GDP from 1990-2009. By Curious Cat Investing and Economics Blog, Creative Commons Attribution. Data source: IMF

    ___________________________

    There are plenty of reasons to question this data but I think it gives a decent overall picture of where things stand. It may seem like government debt should be an easy figure to know but even just agreeing what would be the most reasonable figure for one country is very difficult, comparing between countries gets even more difficult and the political pressures to reduces how bad the data looks encourages countries to try and make the figures look as good as they can.

    The poster child for irresponsible spending is Japan which has gross government debt of 218% of GDP (Japan’s 2009 figure is an IMF estimate). Greece is at 115%. Gross debt is not the only important figure. Government debt held within the country is much less damaging than debt held by those outside the country. Japan holds a large portion of its own debt. If foreigners own your debt then debt payments you make each year are paid outside your country and it is in essence a tax of a portion of your economic production that must be paid. If the debt is internal it mean taxpayers have to support bond holders each year (but at least when those bondholders spend the money it stays within your economy).
    (more…)

  • Auto Manufacturing in 2009: USA 5.7 million, Japan 7.9 million, China 13.8 million

    This webcast includes lots of interesting data on China’s economy (the SAIC green transportation concepts is also interesting but not as much as the economic data, to me). I knew China had overtaken the USA in purchases of new cars. I knew China continues to grow manufacturing output amazingly. I did not know how incredibly rapidly Chinese growth in manufacturing cars has been in the last couple of years.

    In 2007 the USA produced 10.8 million cars and light trucks, Japan 11.6 million, China 8.9 million. In 2008 USA 8.7 million, Japan 11.6 million, China 9.3 million. In 2009 USA 5.7 million, Japan 7.9 million and China 13.8 million. That is an amazingly quick transformation. The credit crunch is obviously a big part of the issue but the bigger story is the growth on the broad Chinese consumer economy (most of those Chinese cars are being bought in China).

    Another interesting country is India: In 2007 they produced 2.3 million, 2008 2.3 million and in 2009 2.6 million. Global production: 2007 – 73 million, 2008 – 70 million, 2009 – 62 million.

    The webcast includes more interesting statistics. More than 250 million people have been removed from abject poverty (this is am amazingly great outcome that is often ignored). In 1978, .2% Chinese homes had a refrigerator; by 2008, 94% had refrigerators. In 2030 China will have 220 cities with over 1 million people. Today China has 110.

    Related: Manufacturing Output as a Percent of GDP by CountryChina Forecasts 9.6% GDP Growth, Close to Becoming 2nd Largest Economy (Dec 2009)The Relative Economic Position of the USA is Likely to Decline

  • Manufacturing Output as a Percent of GDP by Country

    In previous posts I have shown data for global manufacturing output by country. One of the things those posts have showed is that manufacturing output in China is growing tremendously, but it is also growing in the United States. The chart below shows manufacturing production by country as a percent of GDP. China dominates again, with over 30% of the GDP from manufacturing.

    chart of manufacturing output as percent of gdp by country 1980-2008

    Chart showing manufacturing output, as percent of GDP, by country was created by the Curious Cat Economics Blog based on UN data* (based on current USA dollars). You may use the chart with attribution.

    For the 14 biggest manufacturing countries in 2008, the overall manufacturing GDP percentage was 23.7% of GDP in 1980 and dropped to 17% in 2008. I left India (15% in 1980, 15% in 2008), Mexico (20%, 18%), Canada (17%, 13%), Spain (25%, 14%) and Russia (21% in 1990 [it was part of USSR in 1980], 15%) off the chart.

    Over the last few decades Korea, and to some extent China, are the only countries that have increased the percent of GDP from manufacturing. China has not only grown manufacturing activity tremendously but also other areas of the economy (construction, mining, information technology). The countries with the largest manufacturing portions of their economies in 2008 were: China 32%, South Korea 25%, Japan and Germany at 21%. The next highest is Mexico at 18% which declined slightly over the last 15 years (with NAFTA in place). Globally, while manufacturing has grown, other areas of economic activity have been growing faster than manufacturing.

    The manufacturing share of the USA economy dropped from 21% in 1980 to 18% in 1990, 16% in 2000 and 13% in 2008. Still as previous posts show the USA manufacturing output has grown substantially: over 300% since 1980, and 175% since 1990. The proportion of manufacturing output by the USA (for the top 14 manufacturers) has declined from 31% in 1980, 28% in 1990, 32% in 2000 to 24% in 2008. The proportion of USA manufacturing has declined from 33% in 1980, 29% in 1990, 36% in 2000 to 30% in 2008. While manufacturing output has grown in the USA it has done so more slowly than the economy overall.

    Related: The Relative Economic Position of the USA is Likely to DeclineManufacturing Data, Accuracy QuestionsTop 12 Manufacturing Countries in 2007Manufacturing Employment Data: 1979 to 2007USA Manufacturing Output Continues to Increase (over the long term)

    * I made edits to the 1980 Brazil manufacturing data and 1980, 1985 and 2008 China manufacturing data because the UN data only showed manufacturing data combined with mining and utility data. And I am using older UN data that had manufacturing separated from mining and utility figures for China in the other years.

  • China Economy Grows 11.9% in 1st Quarter

    China’s GDP increased 11.9% in 1st quarter of 2010, from last year. China is now the 2nd largest economy (overtaking Japan in the last year). More cars will be bought this year in China than any other country (they overtook the USA in 2009). The 4th quarter of 2009 saw an increase of 10.7% above 2008. Real estate appreciation continues and the government reported housing prices in 70 major cities rose 11.7% in March compared to 2009. I believe it would be wise for China to take stronger action to deflate a bubble. Raise rates. Cut back on infrastructure spending. Raise the value of the Yuan.

    March’s China consumer price index was 2.4% higher than a year earlier, while the producer price index was up 5.9%.

    China’s economy feels the heat by Robert M Cutler

    Property prices rose at a record pace in March, up almost 12% from a year earlier, according to the National Bureau of Statistics on Wednesday. This represents a considerable short-term acceleration after housing prices in 70 major cities rose only 1.5% in 2009, according to official data.

    The government has held its overnight interest rate steady at 5.31% since January 2009.

    The government has already moved to slow the real estate market through higher mortgage rates and required down payments and the re-introduction of sales taxes.

    The ministry of housing and urban-rural development has said it intends to crack down on price speculation in the property market and curb attempts to hoard land. Measures being considered include requiring a down payment of 40% on second residences

    Related: China GDP up 8.7% in 2009China Forecasts 9.6% GDP Growth, Close to Becoming 2nd Largest EconomyCapitalism in China

  • USA, China and Japan Lead Manufacturing Output in 2008

    Once again the USA was the leading country in manufacturing in 2008. And once again China grew their manufacturing output amazingly. In a change with recent trends Japan grew output significantly. Of course, the 2009 data is going to show the impact of a very severe worldwide recession.

    Chart showing percent of output by top manufacturing countries from 1990 to 2008
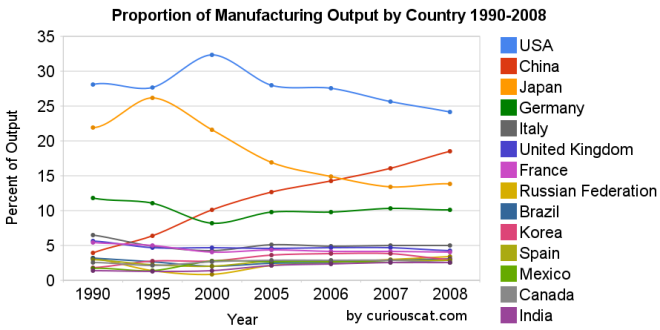
Chart showing the percentage output of top manufacturing countries from 1990-2008 by Curious Cat Management Blog, Creative Commons Attribution.

    The first chart shows the USA’s share of the manufacturing output, of the countries that manufactured over $185 billion in 2008, at 28.1% in 1990, 27.7% in 1995, 32% in 2000, 28% in 2005, 28% in 2006, 26% in 2007 and 24% in 2008. China’s share has grown from 4% in 1990, 6% in 1995, 10% in 2000, 13% in 2005, 14% in 2006, 16% in 2007 to 18% in 2008. Japan’s share has fallen from 22% in 1990 to 14% in 2008. The USA has about 4.5% of the world population, China about 20%. See Curious Cat Investment blog post” Data on the Largest Manufacturing Countries in 2008.

    Even with just this data, it is obvious the belief in a decades long steep decline in USA manufacturing is not in evidence. And, in fact the USA’s output has grown substantially over this period. It has just grown more slowly than that of China (as has every other country), and so while output in the USA has grown the percentage with China has shrunk. The percentage of manufacturing output by the USA (excluding output from China) was 29.3% in 1990 and 29.6% in 2008. The second chart shows manufacturing output over time.

    charts showing the top manufacturing countries output from 1990-2008
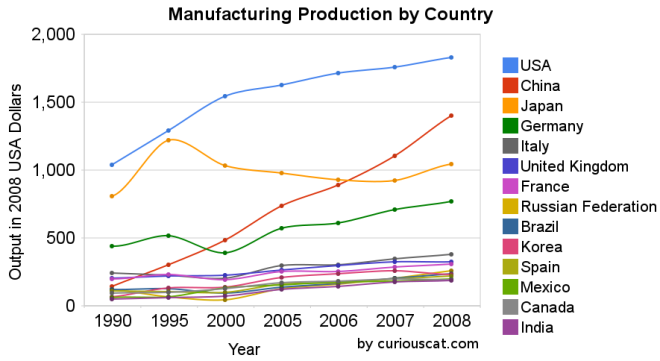
Chart showing the output of the top manufacturing countries from 1990-2008 by Curious Cat Management Blog, Creative Commons Attribution.

    The 2008 China data is not provided for manufacturing alone (the latest UN Data, for global manufacturing, in billions of current USA dollars). The percentage of manufacturing (to manufacturing, mining and utilities) was 78% for 2005-2007 (I used 78% of the manufacturing, mining and utilities figure provided in the 2008 data). There is a good chance this overstates China manufacturing output in 2008 (due to very high commodity prices in 2008).

    Hopefully these charts provide some evidence of what is really going on with global manufacturing and counteracts the hype, to some extent. Global economic data is not perfect. These figures are an attempt to capture the economic reality in the world but they are not a perfect proxy. This data is shown in 2008 USA dollars which is good in the sense that it shows all countries in the same light and we can compare the 1995 USA figure to 2005 without worrying about inflation. However foreign exchange fluctuations over time can show a country, for example, having a decline in manufacturing output in some year when in fact the output increased (just the decline against the USA dollar that year results in the data showing a decrease – which is accurate when measured in terms of USA dollars).

    If the dollar declines substantially between when the 2008 data was calculated and the 2009 data is calculated that will give result in the data showing a substantial increase in those countries that had a currency strengthen against the USA dollar. At this time the Chinese Renminbi has not strengthened while most other currencies have – the Chinese government is retaining a peg to a specific exchange rate.

    Korea (1.8% in 1990, 3% in 2008), Mexico (1.7% to 2.6%) and India (1.4% to 2.5%) were the only countries to increase their percentage of manufacturing output (other than China, of course, which grew from 3.9% to 18.5%).

    Related: posts on manufacturingGlobal Manufacturing Data by Country (2007)Global Manufacturing Employment Data – 1979 to 2007Top 10 Manufacturing Countries 2006Top 10 Manufacturing Countries 2005

  • China GDP up 8.7% in 2009

    China’s GDP Growth Accelerates to Fastest Since 2007

    Gross domestic product rose 10.7 percent from the same period a year ago, more than the median forecast of 10.5 percent in a Bloomberg News survey, a statistics bureau report showed in Beijing today. For the full year, GDP gained 8.7 percent, beating Premier Wen Jiabao’s 8 percent target.

    The report may stoke speculation the central bank will start raising its benchmark interest rate and tighten restrictions on the nation’s lenders. Minutes after the release, traders said the People’s Bank of China guided three-month bill yields higher at an auction for the second time in two weeks.

    Fourth-quarter economic growth was driven by an unprecedented $586 billion stimulus package, subsidies for consumer purchases and a credit-fueled investment boom. The property market has rebounded and a 13-month slump in exports ended last month.

    Industrial production grew 18.5 percent in December from a year earlier and retail sales climbed 17.5 percent, the statistics bureau said today.

    In 2008 China’s GDP was up 9.6%. The economy there obviously continues to do amazing things. Also there are plenty of signs of crazy spending building huge amounts of housing and office space that lies vacant and questionable infrastructure projects. There is certainly a risk of bubbles bursting in China but the long term strength of the economy seems real. The danger is first political with financial bubbles being the second risk – I think.

    Related: Japanese Economy Shrinks 12.7% in the 4th Quarter of 2008Data on the Largest Manufacturing Countries in 2008Oil Consumption by Country in 2007

  • China Forecasts 9.6% GDP Growth, Close to Becoming 2nd Largest Economy

    China has been growing incredibly quickly for years. The credit crisis slowed things down. But unlike so many other governments that spent all their resources and more in good times, China has plenty of cash and spent a great deal on large projects. That spending has boosted their economy. And with that encouragement their economy has continued to grow, including consumer spending. As I posted earlier, China May Take Car Sales Lead from USA in 2009.

    China Raises GDP Growth Estimates, Narrowing Gap With Japan

    China’s expansion will be more than 8 percent in 2009, according to government officials, and the nation is poised to overtake Japan [in GDP] next year, International Monetary Fund projections show.

    China’s expansion in 2008 compares with U.S. growth of less than 1 percent. Japan’s gross domestic product shrank 1.2 percent. The Indian economy expanded 6.7 percent in the fiscal year ended March 2009.

    Economic data always has some errors within, and from China the data is even less reliable. But the overall strength seem very real and significant.

    Related: Government Debt Compared to GDP 1990-2007Japanese Economy Grew at 3.7% Annual Rate (Aug 2009)

  • Hans Rosling Data on Economic Development and Health Results

    Hans Rosling uses his fascinating data-bubble software to burst myths about the developing world. Look for new analysis on China and the post-bailout world, mixed with classic data shows.

    “The worldview students have corresponds to reality the year their teachers were born”

    The software he uses, the very cool Gapminder world, developed by his son and bought by Google is available online.

    He also correctly congratulates the USA for providing free data it has collected worldwide, for decades, on world health. And correctly criticizes the World Bank for selling the data they compile using taxpayer funds.

    Related: Data Visualization Health Care ExampleEconomic Measurement Issues Arising from GlobalizationMillennium Development GoalsGovernment Debt Compared to GDP 1990-2007

  • The Truth Behind China’s Currency Peg

    Peter Schiff does a good job of explaining The Truth Behind China’s Currency Peg

    The peg, they argue, offers China a competitive advantage by making its products cheaper in U.S. markets, thus allowing Chinese firms to gobble up market share and steal jobs from U.S. manufacturers. The thought is that were China to allow its currency to rise, American manufactures would regain their lost edge, and both manufacturing firms and the jobs formerly associated with them would return.

    In fact, for the U.S., de-pegging would cause the economic equivalent of cardiac arrest. Our economy is currently on life support provided by an endless flow of debt financing from China. These purchases are the means by which China maintains the relative value of its currency against the dollar. As the dollar comes under even more downward pressure, China’s purchases must increase to keep the renminbi from rising. By maintaining the peg, China enables our politicians and citizens to continue spending more than they have and avoiding the hard choices necessary to restore our long-term economic health.

    As demand falls for both dollars and Treasuries, prices and interest rates in the United States will rise. Rising rates will restrict the flow of credit that is currently financing government and consumer spending. This change will finally force a long overdue decline in borrowing.

    De-pegging will force the hand of U.S. politicians toward pursuing realistic policies. The Chinese will come to their senses eventually because it is in their interest to do so. Meanwhile, the longer the peg is maintained, the more indebted we become, the more out of balance our economy grows, and the more our industrial base shrivels. In short, the longer they wait, the steeper our fall.

    I agree the largest impact of the currency peg on the USA is supporting our economy in the short run. If we didn’t go into huge debt it would actually be good for the USA for the long run too. Essentially China subsidies our purchases and borrowing. The problem is that we have taken a good thing too far and become used to living beyond our means. That is not sustainable – even with a subsidy from China.

    I disagree that the USA manufacturing base is hollowed out. It is strong in comparison to the rest of the world, except China. China’s manufacturing growth has been phenomenal, compared to that everyone looks weak. Manufacturing jobs are disappearing everywhere, not just in the USA.

    Related: Top 10 Manufacturing Countries in 2008 – China and the Sugar Industry Tax Consumers – Why the Dollar is FallingWho Will Buy All the USA’s Debt?Peter Schiff Answers Redditers Questions