Tag: economic data

  • Capacity Utilization Rate Up Slightly From All Time Low

    chart of USA capacity utilization rate 1972-2009
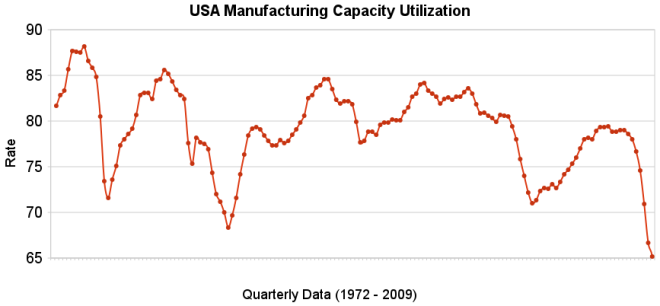
The chart shows the capacity utilization rate in the USA. By Curious Cat Investing Economics Blog, Creative Commons Attribution, data from the Federal Reserve.

    Industrial production increased .5% in July and capacity utilization rate increased to 68.5% from an all time low of 68.1%. Capacity utilization has averaged 80.9% from 1972 to today.

    Manufacturing output increased 1.0% in July but remained 14.4% lower than its year-earlier level. The factory operating rate rose to 65.4% in July, 70 basis points above the historical low recorded in June; the series begins in 1948. Production in durable goods industries advanced 2.2% in July. In addition to the sharp increase in motor vehicles and parts output, large production gains occurred for nonmetallic mineral products and for primary metals. The indexes for wood products, computer and electronic products, aerospace and miscellaneous transportation equipment, furniture and related products, and miscellaneous goods also rose. The indexes for fabricated metal products, machinery, and electrical equipment declined.

    The production of nondurable goods fell 0.1% in July. The indexes for textile and product mills and for printing and support recorded sizable declines; the indexes for food, beverages, and tobacco and for petroleum and coal products also declined. The output of paper, of chemicals, and of plastic and rubber products increased.

    The index for other manufacturing, which consists of publishing and logging, was down 0.6% in July.

    The output of electric and gas utilities decreased 2.4%, and the operating rate for utilities dropped 21 basis points, to 77.6%. Mining production moved up 0.8%; its utilization rate in July, at 81.7%, was 59 basis points below its 1972-2008 average.

    Data from the St. Louis Federal Reserve and Federal Reserve August 14th Industrial Production and Capacity Utilization press release.

    Related: Loan Default Rates: 1998-2009Government Debt as a Percentage of GDPUSA Spent $2.2 Trillion, 16.2% of GDP, on Health Care in 2007
    (more…)

  • Japanese Economy Grew at 3.7% Annual Rate

    On the heels of the Japanese economy shrinking at 12.7% rate 2 quarters ago, the Japanese economy grew at a 3.7% annual rate in the second quarter. Japan is the 2nd largest economy (after the USA). Japan’s economy leaves recession:

    If Japan’s latest quarterly rate were maintained for a full year, the economy would grow 3.7%

    Japan is heavily reliant on its exports so growth overseas could bode well for its recovery.

    The French and German economies both grew by 0.3% between April and June, bringing to an end recessions in Europe’s largest economies that have lasted a year. Analysts had not expected the data, suggesting recovery could be faster than previously expected.

    And Hong Kong recorded growth of 3.3% in the three months from April to June. That data was also better than had been expected, with the government subsequently increasing its forecast for growth in the whole year.

    The global economic recovery seems to be taking shape more quickly than anticipated. However, we are still far from in the clear. The risks to short term economic recovery are still great. And the largest long term economic problems for the USA (massive federal debt, huge consumer debt [both the government and the people living far beyond their means] and an very expensive and harmful health care system) have not been addressed. If we are very very lucky the increased saving rate in the last 6 months will continue but it is very questionable if that will continue.

    Related: Manufacturing Employment Data, 1979 to 2007Government Debt as a Percentage of GDPPoliticians Again Raising Taxes On Your Children (Jan 2008)

  • Move to Finland for Cell Phone Service Savings

    Ok, maybe moving to lower your cell phone bill would be a bit extreme. But the cost of cell phone service is almost 5 times as high in the USA as in Finland:
    Mobile phone calls lowest in Finland, Netherlands and Sweden

    Finland, the Netherlands and Sweden have the lowest prices for mobile phone calls among OECD countries, according to the latest OECD Communications Outlook. The highest were found in Canada, Spain and the United States.

    Comparing prices on a medium-use basis for a package of 780 voice calls, 600 short texts (SMS), and eight multimedia (MMS) messages, the survey found monthly prices ranged from 11 to 53 US dollars across countries as of August 2008.

    The OECD Communications Outlook says between 2006 and 2008 mobile phone call prices fell on average by 21% for low usage consumers, 28% for medium usage and by 32% for subscribers with the highest consumption patterns.

    Related: Kiss Your Phone Bill Good-byemoney saving ideasInvesting dictionary

  • Commercial Real Estate Market Still Slumping

    Fed Focusing on Real-Estate Recession as Bernanke Convenes FOMC

    The collapse in commercial real estate is preventing Federal Reserve Chairman Ben S. Bernanke from declaring the economy and financial markets are healed. Property values have fallen 35 percent since October 2007, according to Moody’s Investors Service.

    Commercial property is “certainly going to be a significant drag” on growth, said Dean Maki, a former Fed researcher who is now chief U.S. economist in New York at Barclays Capital Inc., the investment-banking division of London-based Barclays Plc. “The bigger risk from it would be if it causes unexpected losses to financial firms that lead to another financial crisis.”

    Any sales of mortgage-backed bonds would be the first new issues in the $700 billion U.S. market for commercial-mortgage- backed securities since it was shut down by the credit freeze in 2008. About $3 billion are in the pipeline, and the success of these sales may foster as much as $25 billion in total deals in the next six months

    Forty-seven percent of loans at the 7,000-plus smaller U.S. lenders are in commercial real estate, compared with 17 percent for the biggest banks…

    Related: Data Shows Subprime Mortgages Were Failing Years Before the Crisis HitHome Values and Rental RatesRecord Home Price Declines (Sep 2008)

  • Unemployment Rate Drops Slightly to 9.4%

    The USA unemployment rate dropped slightly to 9.4%. The economy lost 247,000 jobs which is both a sign the economy is not strong and also that it is improving (job losses from November through April were 645,000/month and 331,000/month from May through July). The job losses for May and June were both revised to show 20,000 fewer job losses each in the press release from the Bureau of Labor Statistics.

    The number of long-term unemployed (those jobless for 27 weeks or more) rose by 584,000 over the month to 5.0 million. In July, 1 in 3 unemployed persons were jobless for 27 weeks or more.

    The employment-population ratio, at 59.4%, was little changed over the month but has declined by 330 basis points since the recession began in December 2007. About 2.3 million persons were marginally attached to the labor force in July, 709,000 more than a year earlier (The data are not seasonally adjusted). These individuals, who were not in the labor force, wanted and were available for work and had looked for a job sometime in the prior 12 months. They were not counted as unemployed because they had not searched for work in the 4 weeks preceding the survey.

    In July, the average workweek of production and nonsupervisory workers on private nonfarm payrolls edged up by 0.1 hour to 33.1 hours. The manufacturing workweek increased by 0.3 hour to 39.8 hours. Factory overtime was unchanged at 2.9 hours.

    This news supports the increasing livelihood of a weak recovery taking hold during 2009 – which is frankly pretty amazing in my opinion. The economy could certainly have taken longer to recover. Still, more job losses and an increasing unemployment rate are likely before the end of 2009.

    Related: Another 450,000 Jobs Lost in JuneUSA Unemployment Rate Jumps to 9.4% (May 2009)USA Unemployment Rate Rises to 8.1%, Highest Level Since 1983 (March 2009)
    (more…)

  • Bond Yields Show Dramatic Increase in Investor Confidence

    graph of 10 year Aaa, Baa and corporate bond rates from 2005-2009
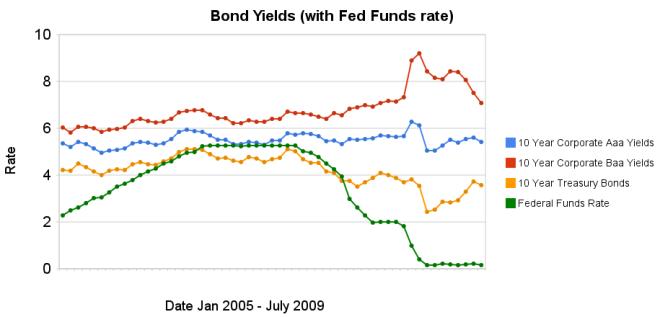
Chart showing corporate and government bond yields by Curious Cat Investing Economics Blog, Creative Commons Attribution, data from the Federal Reserve.

    The changes in bond yields over the last 3 months months indicate a huge increase in investor confidence. The yield spread between corporate Baa 10 year bonds and 10 year treasury bonds increased 304 basis points from July 2008 to December 2008, indicating a huge swing in investor sentiment away from risk and to security (US government securities). From April 2009 to July 2009 the yield spread decreased by 213 basis points showing investors have moved away from government bonds and into Baa corporate bonds.

    From April to July 10 year corporate Aaa yields have stayed essentially unchanged (5.39% to 5.41% in July). Baa yields plunged from 8.39% to 7.09%. And 10 year government bond yields increased from 2.93% to 3.56%. federal funds rate remains under .25%.

    Investors are now willing to take risk on corporate defaults for a much lower premium (over government bond yields) than just a few months ago. This is a sign the credit crisis has eased quite dramatically, even though it is not yet over.

    Data from the federal reserve: corporate Aaacorporate Baaten year treasuryfed funds

    Related: Continued Large Spreads Between Corporate and Government Bond Yields (April 2009)Chart Shows Wild Swings in Bond Yields (Jan 2009)investing and economic charts

  • Lazy Portfolios Seven-year Winning Streak

    Here is an excellent article on how to invest in the stock market. I personally tweak this advice a bit but it is much better than most advice you get. Basically keep costs down (don’t pay large fees) and diversify. Lazy Portfolios seven-year winning streak by Paul Farrell

    Greed drives this [mutual fund] industry. The “world’s largest skimming operation” has now lost over 50% of America’s savings in the decade since the peak of 2000. The track record of actively managed funds during the recent subprime-credit meltdown continues to prove that the industry is failing America. The only way to invest is with index funds, which make up just 14% of the total.

    In short, even though we know that the average compensation of portfolio managers is often $400,000 to more than a $1 million, the hot-shot managers of these actively managed funds provided no value-added to their funds’ performance. Conclusion: Their investors would be better off investing in index funds.

    Yes, the market was in negative territory the past few years, but still all eight Lazy Portfolios outperformed each of the six actively-managed funds.

    Customize your own Lazy Portfolio following these six rules and you’ll win. More important, you’ll have lots of time left to enjoy what really counts, your family, friends, career, sports, hobbies, living.

    2) Frugality, savings versus financial obesity. Tools like starting early, autopilot saving plans, dollar-cost averaging, frugal living and other tricks are familiar to long-term investors. Trust your frugality instincts — living below your means — it’s a trait common among America’s “millionaires next door.”

    Related: Lazy Portfolio Results (April 2008)Allocations Make A Big Difference12 stocks for 10 years401(k)s are a Great Way to Save for Retirement

  • Apartment Vacancy at 22-Year High in USA

    Apartment Vacancy at 22-Year High in U.S.

    Vacancies climbed to 7.5 percent from 6.1 percent a year earlier, New York-based real estate research firm Reis Inc. said today. The last time landlords had so much empty space was in 1987, when vacancies reached 7.6 percent

    Asking rents for apartments fell 0.6 percent in the second quarter from the first, Reis said. That matched the rate of change in the first quarter, the biggest drop since Reis began reporting such data in 1999.

    New York had the lowest vacancy rate in the second quarter, at 2.9 percent, followed by New Haven, home to Yale University; Central New Jersey; New York’s Long Island; and Syracuse, New York, according to Reis.

    Related: Housing Rents Falling in the USARent Controls are UnwiseIt’s Now a Renter’s Marketarticles on investing and real estate

  • The Long-Term USA Federal Budget Outlook

    The decisions over the past 30 years to pass huge huge tax bills to those in the future is unsustainable. Saying you cut taxes when all you actually do is postpone them is dishonest. However, many people go along with such false statements so politicians have learned to buy votes today by raising taxes on the future. Since the public keeps voting for such people when the facts are clear the only explanation is they support raising taxes, not today, but in the future (or, I suppose, they are not able to understand the clear implications of what they vote for). The Long-Term Budget Outlook

    Under current law, the federal budget is on an unsustainable path, because federal debt will continue to grow much faster than the economy over the long run. Although great uncertainty surrounds long-term fiscal projections, rising costs for health care and the aging of the population will cause federal spending to increase rapidly under any plausible scenario for current law.

    For decades, spending on Medicare and Medicaid has been growing faster than the economy. CBO projects that if current laws do not change, federal spending on Medicare and Medicaid combined will grow from roughly 5 percent of GDP today to almost 10 percent by 2035. By 2080, the government would be spending almost as much, as a share of the economy, on just its two major health care programs as it has spent on all of its programs and services in recent years.

    CBO projects that Social Security spending will increase from less than 5 percent of GDP today to about 6 percent in 2035 and then roughly stabilize at that level.

    Federal interest payments already amount to more than 1 percent of GDP; unless current law changes, that share would rise to 2.5 percent by 2020.

    The cost of paying for a dysfunctional medical system has been a huge drain on the USA economy for decades. But that is nothing compared to what the future holds if we don’t adopted sensible strategies that reduce the huge extra costs we pay and the worse performance we receive for that cost.

    Social security is not the huge problem many think it is. Still I would support reducing the payout to wealthy individuals and bringing the age limits more in line with the changes in life expectancy. 12.4% of pay for low and middle wage workers (high income earners stop paying social security taxes so in effect marginal tax rates decrease by 12% for any income above $106,800). Medicare taxes add 2.9% bringing the total social security and Medicare taxes to 15.1% (including both the amount paid directly by the employee and the amount paid for the employee by the employer).

    Related: True Level of USA Federal DeficitUSA Federal Debt Now $516,348 Per Householdquotations about economicsarticles on improving the health care systemUSA Spent $2.2 Trillion, 16.2% of GDP, on Health Care in 2007

  • Bad Math, Bad Statistics

    Here is a good blog post showing one great feature of the blogosphere (that term seems to have fallen out of use hasn’t it): interaction. It also shows that you have to think critically. You can’t just accept what you read (you never can, but that is even more true with blogs than it is with newspapers that at least have some standards normally). I tend to agree with this posts look at the data, though I have not examined the issue closely.

    Bad Math, Bad Statistics: Trying to get a blogger to admit a mistake

    So what’s wrong with this picture? If you guessed, “he’s comparing a gross value with per capita value” you win a cookie. US population is increasing all the time, and therefore, even if per capita incomes have dropped, that doesn’t mean total income hasn’t. So if you multiply those figures by the population and then compare them, you get this (source):

    1981: 229465714 * 8476.0 = 1.944 trillion
    1992: 255029699 * 14847.0 = 3.786 trillion (94% gain)
    2005: 292892127 * 25036.0 = 7.332 trillion (93.6% gain)

    Er, doesn’t look like a lag to me. In fact, it looks like it’s doubling every 12-13 years just as much as GDP is. I also looked up total income statistics for the US, and found the following figures (source). (Note these figures are different. More on that later.)

    1981: $2,580,600,000 (2.58 / 3.1 = 83% of GDP)
    1992: $5,349,384,000 (more than double!) (5.34 / 6.2 = 86% of GDP)
    2005: $10,252,973,000 (another double!) (10.25 / 12.4 = 82% of GDP)

    Anyway it is a much more interesting argument than I would hear when I listened to TV “pundits” years ago spout meaningless talking points at each other. Granted they argument is not going to be studied as a wonderful example of how we should debate. Still it is much above what passes for debate from our politicians (yes this is more a sad commentary on how failed our politicians are than a statement of how marvelous the argument on the GDP issue is between the two bloggers).

    Here is a math question for you, what has a bigger impact moving from 15 to 18 mpg or 50 to 100 mpg?

    Related: Government Debt as a Percentage of GDPUSA Consumers Paying Down DebtIs Productivity Growth Bad?Americans are Drowning in Debt