Tag: economic data

  • Home Prices Fall by Record 19%

    Home prices fall by record 19.1 percent in 1Q

    The National Index, which is released quarterly and covers a broader area than the monthly 20- and 10-city indexes, posted a 19% drop in the first quarter from a year earlier and a 7.5% decline from the fourth quarter.

    New York still is up 73.4% from January 2000, though down 19.7% from its June 2006 peak. The Detroit index is 29% lower than in January 2000. Detroit home prices are back to their mid-1995 levels.

    Phoenix, Las Vegas and San Francisco continued to lead year-over-year decliners, with drops over 30%. Minneapolis led month-to-month decliners, as the rate of decline accelerated there. The rates of decline also accelerated in Boston, Detroit, Las Vegas, Miami, New York, Portland, San Diego and Seattle.

    Dallas, Denver, Cleveland, Boston and Charlotte managed to avoid double-digit year-over-year declines. Measuring from each market’s peak, Dallas has suffered the least, down 11.1% from its peak in June 2007; while Phoenix is down 53% from its peak in June of 2006. All of the 20 metro areas are in double digit declines from their peaks, with two — Phoenix and Las Vegas — in excess of 50%.

    Related: Home Price Declines Exceeding 10% Seen for 20% of Housing Markets (Sep 2007)Nearly 10% of Mortgages Delinquent or in ForeclosureRecord Home Price Declines (Sep 2008)

  • Can unemployment claims predict the end of the American recession?

    Can unemployment claims predict the end of the American recession? by Robert J. Gordon

    Since economists are notoriously poor at forecasting turning points, this hope is likely to be dismissed as a will o’ the wisp. But is it wisely dismissed? Recently I have discovered a surprisingly tight historical relationship in past US recessions between the cyclical peak in new claims for unemployment insurance (measured as a four-week moving average) and the subsequent NBER trough.

    To this point I have examined a single indicator to see if it is useful in predicting the end of recessions without any consideration of what is going on in the rest of the economy. Our conclusion is supported by the fact that previous false peaks occurred when new claims were at 80 to 90% of the level at the ultimate true peak. For the peak of 4 April 2009 to be false by this historical precedent, the ultimate future peak would have to be in the range of 730,000 to 800,000. As the weeks go by, such a sharp future increase in new claims looks increasingly implausible.

    My reasoning leads me to conclude that the ultimate NBER trough of the current business cycle is likely to occur in May or June 2009, substantially earlier than is currently predicted by many professional forecasters.

    Interesting points. Time will tell what happens. I am skeptical this measure alone will prove to be perfect but I can believe it will be one useful measure to consider. I tend to be skeptical we are close to a strong recovery. But at what point the economy moves out of a recession is less certain. I still believe we will be lucky if we show job gains by the end of this year.

    Related: How Much Worse Can the Mortgage Crisis Get? (March 2008)Unemployment Rate Increased to 8.9%Manufacturing Employment Data – 1979 to 2007First Quarter 2009 GDP down 6.1%Poll: 60% say Depression Likely (Oct 2008)

  • Unemployment Rate Increased to 8.9%

    Nonfarm payroll employment continued to decline in April, and the unemployment rate rose from 8.5 to 8.9 percent, the Bureau of Labor Statistics of the U.S. Department of Labor reported today. Since the recession began in December 2007, 5.7 million jobs have been lost. In April, job losses were large and widespread across nearly all major private-sector industries. Overall, private-sector employment fell by 611,000.

    The number of unemployed persons increased by 563,000 to 13.7 million. Unemployment rates for April for adult men reached 9.4% and for adult women 7.1%. The number of long-term unemployed (those jobless for 27 weeks or more) increased by 498,000 to 3.7 million over the month and has risen by 2.4 million since the start of the recession in December 2007.

    The civilian labor force participation rate rose in April to 65.8 percent, and the employment-population ratio was unchanged at 59.9 percent. The employment-population ratios for adult men and women showed little or no change over the month. However, since December 2007, the men’s ratio was down by 440 basis points, while the women’s ratio was down by 130 basis points. Since those that stop looking for work (retire or just stop actively looking) are not counted as unemployed the participation rate is a useful statistic to examine in conjunction with the unemployment rate.

    Much of the commentary on the April job losses have been that the decrease in the number of job losses from previous months shows the economy is stabilizing. While it is true losing 611,000 jobs is better than losing 700,000 jobs, losing 611,000 is still very bad. The unemployment rate increased to 8.9% and long term unemployment is increasing drastically. This is hardly good economic news. It is true that there is hope that the economy is turning around, but the employment data we have so far is hardly positive (employment data is a lagging economic indicator so it is not surprising employment data does not recover before other signs point to improvement).

    Related: Another 663,000 Jobs Lost in March in the USAUSA Unemployment Rate Rises to 8.1%, Highest Level Since 1983Over 500,000 Jobs Disappeared in NovemberWhat Do Unemployment Stats Mean?

  • USA Consumers Paying Down Debt

    Consumer borrowing falls in March at fastest pace in over 18 years, Americans saving more

    Consumer borrowing plunged in March at the fastest pace in 18 years as Americans put away their credit cards and hoarded cash amid the worst recession in decades. The Federal Reserve said Thursday that consumer borrowing dropped 5.2 percent in March, the biggest decline since an 8.1 percent fall in December 1990.

    In dollar terms, consumer borrowing plunged by $11.1 billion. That’s the largest dollar amount on records dating to 1943, and more than three times the $3.5 billion drop that economists expected. The borrowing category that includes credit cards dropped 6.8 percent in March after a 12.1 percent plunge in February. The category that includes auto loans fell 4.2 percent after rising by 1.2 percent in February.

    The Commerce Department last week said that the personal savings rate edged up to 4.2 percent in March, marking the first time in a decade that the savings rate has been above 4 percent for three straight months.

    Good. Consumer debt is far to large and should be paid down. This is a start but a small start, but a much larger reduction in outstanding consumer debt is needed before we have reached a healthy level of debt. The continued improvement in that debt level signifies a stronger economy. Far too many financial journalists instead of pointing out the benefits of such improvement note that this reduces current consumption (and thus, effectively, will lower current GDP – compared to what it would be if we continued to spend beyond our means). You cannot spend money your don’t have forever.

    Having more stuff in your house (along with an increased outstanding credit card balance) does not make you economically more successful. And the same holds true for the economy. Having more stuff sitting in people’s house and an increasing debt load is not the sign of a stronger economy (even if it is a route to a higher current GDP). Increased saving and reducing debt will strengthen the economy and improve our economic success over the long term.

    Related: Will Americans Actually Save and Worsen the Recession?Proper credit card usePersonal Saving and Personal Debt in the USAAmericans are Drowning in DebtBuying Stuff to Feel Powerful

  • Huge New Natural Gas Discoveries in the USA

    U.S. Gas Fields Go From Bust to Boom

    Even conservative estimates suggest the Louisiana discovery — known as the Haynesville Shale, for the dense rock formation that contains the gas — could hold some 200 trillion cubic feet of natural gas. That’s the equivalent of 33 billion barrels of oil, or 18 years’ worth of current U.S. oil production. Some industry executives think the field could be several times that size.

    Huge new fields also have been found in Texas, Arkansas and Pennsylvania. One industry-backed study estimates the U.S. has more than 2,200 trillion cubic feet of gas waiting to be pumped, enough to satisfy nearly 100 years of current U.S. natural-gas demand.

    The discoveries have spurred energy experts and policy makers to start looking to natural gas in their pursuit of a wide range of goals: easing the impact of energy-price spikes, reducing dependence on foreign oil, lowering “greenhouse gas” emissions and speeding the transition to renewable fuels.

    new technologies and a drilling boom have helped production rise 11% in the past two years. Now there’s a glut, which has driven prices down to a six-year low and prompted producers to temporarily cut back drilling and search for new demand.

    The natural-gas discoveries come as oil has become harder to find and more expensive to produce. The U.S. is increasingly reliant on supplies imported from the Middle East and other politically unstable regions. In contrast, 98% of the natural gas consumed in the U.S. is produced in North America.

    Related: Oil Consumption by Countryposts on energy economicsForecasting Oil PricesSouth Korea To Invest $22 Billion in Overseas Energy ProjectsWind Power Provided Over 1% of Global Electricity in 2007

  • First Quarter GDP 2009 down 6.1%

    First Quarter GDP 2009 in the USA was down 6.1%. This is after a revised 6.3% drop in fourth quarter of 2008 (preliminary fourth quarter report showed a 6.2% decline). Real exports of goods and services decreased 30% in the first quarter, compared with a decrease of 23.6% in the fourth. Real imports of goods and services decreased 34.1%, compared with a decrease of 17.5%.

    The personal saving rate — saving as a percentage of disposable personal income — was 4.2% in the first quarter, compared with 3.2% in the fourth quarter of 2008.

    The news certainly is nothing to be happy about. But the stock markets around the world were buoyed by the Federal Reserves positive words:

    Information received since the Federal Open Market Committee met in March indicates that the economy has continued to contract, though the pace of contraction appears to be somewhat slower. Household spending has shown signs of stabilizing but remains constrained by ongoing job losses, lower housing wealth, and tight credit. Weak sales prospects and difficulties in obtaining credit have led businesses to cut back on inventories, fixed investment, and staffing.

    Although the economic outlook has improved modestly since the March meeting, partly reflecting some easing of financial market conditions, economic activity is likely to remain weak for a time. Nonetheless, the Committee continues to anticipate that policy actions to stabilize financial markets and institutions, fiscal and monetary stimulus, and market forces will contribute to a gradual resumption of sustainable economic growth in a context of price stability.

    True, those words hardly sound like great news but the markets were quite happy.

    Related: The Economy is in Serious Trouble (Nov 2008)Warren Buffett Webcast on the Credit CrisisFed Continues Wall Street Welfare (March 2008)Manufacturing Data – Accuracy Questions

  • April 2009 Federal Reserve Beige Book

    Federal Reserve Beige Book highlights for April 15th. The Beige Book documents comments received from business and other contacts outside the Federal Reserve and is not a commentary on the views of Federal Reserve officials. The book is published eight times a year.

    Manufacturing activity continued to decline in most Districts and across a wide range of industries. Several reports, however, noted that the pace of decline had slowed or that factory activity had stabilized. The Boston, Philadelphia, Richmond, Atlanta, St. Louis, Minneapolis, and San Francisco Districts cited decreases in production. The Chicago and Kansas City Districts said declines in production had slowed.

    Manufacturers’ assessments of future factory activity improved marginally over the survey period as well.

    Consumer spending remained generally weak. However, several Districts said sales rose slightly or declines moderated compared with the previous survey period.

    Home prices continued to decline in most Districts, although a few reports noted that prices were unchanged or that the pace of decline had eased. Low mortgage rates were fueling refinancing activity. Outlooks for the housing sector were generally more optimistic than in earlier surveys, with respondents hopeful that increased buyer interest would lead to better sales.

    Commercial real estate investment activity weakened further.

    Labor market conditions were weak and reports of layoffs, reductions in work hours, temporary factory shutdowns, branch closures and hiring freezes remained widespread across Districts.

    Related: Central Bank Intervention Unprecedented in scale and ScopeWhy do we Have a Federal Reserve Board?Manufacturing Employment Data – 1979 to 2007Oil Consumption by Country

  • It’s Now a Renter’s Market

    It’s Now a Renter’s Market by Prashant Gopal

    Effective rents fell in 64 of 79 markets that Reis tracks. Effective rents in San Francisco dropped 2.8% in the first quarter of this year, compared with the previous quarter—the nation’s largest quarterly decline. Rents fell 2.6% in New York City (all five boroughs), 1.3% in Charlotte, 2.5% in San Jose, 0.9% in San Antonio, 0.9% in Cleveland, 1.2% in Chicago, and 2.3% on Long Island.

    Oklahoma City, where people spent just 12% of their income on rent, was the most affordable. Other cheap markets included Indianapolis, Denver, Fort Worth, and Cleveland. The least affordable market was New York, where people spent 57% of their income on rent.

    Rental markets are driven largely by 2 factors, vacancy rates and jobs. If jobs in a metropolitan area are increasing rents usually increase. If more new apartments are added to the market than jobs (which then increases vacancy rates) this will push down rates. Other factors influence vacancy rates (such as people moving back in with parent, people sharing apartments…). Those factors often are largely influenced by losing jobs in an area.

    D.C. apartment market remains strong

    The D.C. area continues to boast one of the best apartment markets in the U.S., with a vacancy rate well below the national number

    Rent increases over the past 12 months for all investment grade apartments kept under the long-term average of 4.2 percent per annum, at 0.5 percent since March 2008.

    Related: Housing Rents Falling in the USAHome Values and Rental RatesReal estate investing articlesUrban PlanningLonger Commutes Translate to Larger Housing Price Declines
    (more…)

  • Continued Large Spreads Between Corporate and Government Bond Yields

    graph of 10 year Aaa, Baa and corporate bond rates from 2005-2009
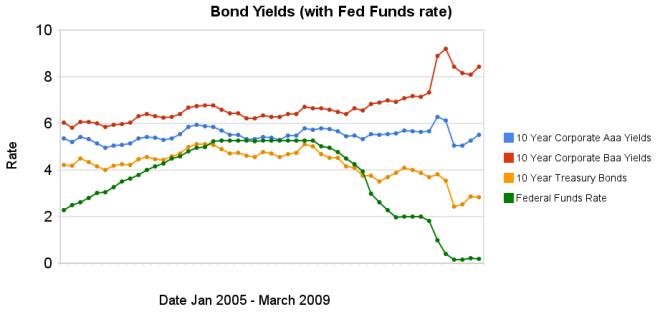
Chart showing corporate and government bond yields by Curious Cat Investing Economics Blog, Creative Commons Attribution, data from the Federal Reserve.

    The federal funds rate remains under .25%. The large spread between government bonds and corporate bonds remains very large. In the last 3 months the yields on Aaa corporate bonds have increased 45 basis points, Baa corporate bond yields have decreased 1 basis points, while treasury bond yields have increased 40 basis points.

    The spread between 10 year Aaa corporate bond yields and 10 year government bond yields is now 268 basis points. In January, 2008 the spread was 159 points. The larger the spread the more people demand in interest, to compensate for the increased risk. The spread between government bonds and Baa corporate bonds decreased to a still very large 566 basis points, the spread was 280 basis point in January 2008, and 362 basis points in September 2008.

    Data from the federal reserve: corporate Aaacorporate Baaten year treasuryfed funds

    Related: Chart Shows Wild Swings in Bond YieldsFed to Start Buying Treasury Bonds TodayCorporate and Government Bond Rates Graph (Oct 2008)investing and economic charts

  • Another 663,000 Jobs Lost in March in the USA

    663,000 jobs were lost in the USA in March and the unemployment rate rose from 8.1 to 8.5 percent, the Bureau of Labor Statistics of the U.S. Department of Labor reported today. Since the recession began in December 2007, 5.1 million jobs have been lost, with almost two-thirds (3.3 million) of the decrease occurring in the last 5 months. In March, job losses were large and widespread across the major industry sectors.

    In March, the number of unemployed persons increased by 694,000 to 13.2 million, and the unemployment rate rose to 8.5 percent. Why is that different than the numbers above? The numbers are from different sources of data, the first from BLS surveys of businesses and the 694,000 from household surveys. This reminds us that this data is approximate, not exact. Undoubtedly the figures will be revised as more data is analyzed.

    Over the past 12 months, the number of unemployed persons has grown by about 5.3 million, and the unemployment rate has risen by 3.4 percentage points. Half of the increase in both the number of unemployed and the unemployment rate occurred in the last 4 months.

    The unemployment rates continued to trend upward in March for adult men, 8.8%, adult women 7.0%, whites 7.9% and Hispanics 11.4%. The jobless rates for African Americans, 13.3% and teenagers 21.7% were little changed over the month. The unemployment rate for Asians was 6.4% in March, not seasonally adjusted, up from 3.6% a year earlier.

    Related: Over 500,000 Jobs Disappeared in NovemberManufacturing Employment Data – 1979 to 2007What Do Unemployment Stats Mean?