Tag: economic data

  • The 20 Most Valuable Companies in the World – June 2015

    The 10 publicly traded companies with the largest market capitalizations. Since October of last year the top 20 list has seen quite a bit of profit for stockholders (mainly in Apple and Chinese companies).

    Company Country Market Capitalization
    1 Apple USA $741 billion
    2 Microsoft USA $374 billion
    3 Google USA $370 billion
    4 Exxon Mobil USA $352 billion
    5 Berkshire Hathaway USA $346 billion
    6 China Mobile China $340 billion*
    7 Industrial & Commercial Bank of China China $306 billion**
    8 Wells Fargo USA $292 billion
    9 GE USA $275 billion
    10 Johnson & Johnson USA $273 billion

    Apple’s market cap is up $115 billion since the last list was created in October of 2014. That increase is more than 50% of the value of the 14th most valuable company in the world (in October 2014).

    China Mobile increased $100 billion and moved into 6th place. Industrial and Commercial Bank of China (ICBC) increased $78 billion to move into 7th place.

    Exxon Mobil lost over $50 billion (oil prices collapsed as OPEC decided to stop attempting to hold back supply in order to maximize the price of oil). Alibaba (the only non-USA company in the last list) and Walmart dropped out of the top 10.

    The total value of the top 20 increased from $5.722 trillion to $6.046 trillion, an increase of $324 billion. Several companies have been replaced in the new top 20 list.

    The next ten most valuable companies:

    Company Country Market Capitalization
    11 JPMorgan Chase USA $250 billion
    12 China Construction Bank China $250 billion**
    13 Novartis (NVS) Switzerland $246 billion
    14 Petro China China $237 billion
    15 Wal-Mart USA $236 billion
    16 Tencent China $235 billion**
    17 Nestle Switzerland $235 billion***
    18 Facebook USA $231 billion
    19 Hoffmann-La Roche (ROG.VX) Switzerland $231 billion
    20 Alibaba China $226 billion

    Market capitalization shown are of the close of business last Friday, as shown on Yahoo Finance.

    The current top 10 includes 8 USA companies and 2 Chinese companies. The 11th to 20th most valuable companies includes 4 Chinese companies, 3 Swiss companies and 3 USA companies. Facebook (after increasing $21 billion), China Construction Bank (increasing $68 billion – it is hard for me to be sure what the value is, I am not sure I am reading the statements correctly but this is my best guess) and Tencent moved into the top 20; which dropped Procter & Gamble, Royal Dutch Shell and Chevron from the top 20.
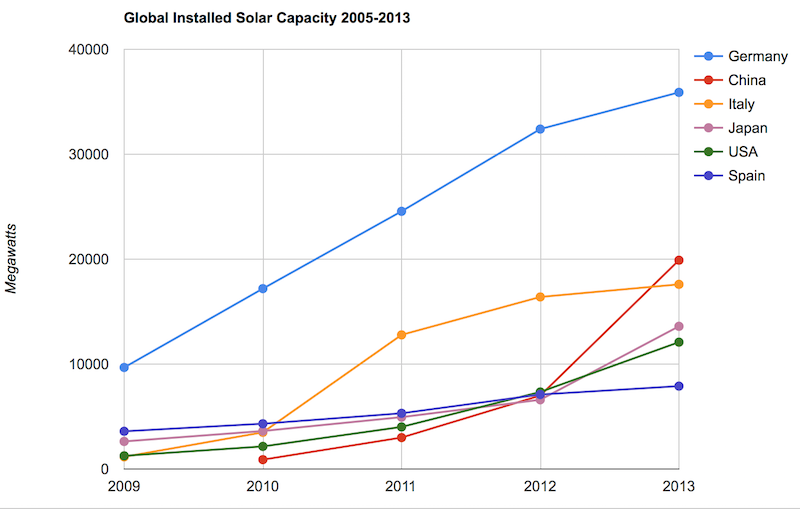
    Related: Historical Stock ReturnsGlobal Stock Market Capitalization from 2000 to 2012Stock Market Capitalization by Country from 1990 to 2010Solar Energy Capacity by Country (2009-2013)

    A few other companies of interest (based on their market capitalization):

    (more…)

  • Solar Energy Capacity by Country

    Solar energy capacity has been growing amazingly quickly the last few years. Part of the reason for this is the starting point was so low, making it easy to have large gains.

    Chart of global solar energy capacity by country 2009 to 2013
    Chart by Curious Cat Economics Blog using data from the US Department of Energy. Chart may be used with attribution as specified here.

    As with so many macro economic measures China has made enormous investments in solar energy the last few years. China’s increase in 2013 was larger than the USA’s total capacity at the end of 2013. Since solar energy use on a large scale is still small investments are quickly ramping up. Europe was a few years ahead of others putting countries like Germany, Spain and Italy far in the lead. China, the USA and Japan have been investing huge amounts the last few years and will likely leave those other than Germany (which already has such a large capacity) far behind very shortly.

    In the USA, even after growing 60% in 2008, 53% in 2009, 71% in 2010, 86% in 2011, 83% in 2012 and 64% in 2013 solar energy capacity only totaled 1% of USA total electrical capacity. In 2013 hydropower was 6.8%, wind was 5.3% and biomass was 1.3%. The increase in solar capacity should continue to grow rapidly and is starting to make significant contributions to the macroeconomic energy picture.

    When you look at total electricity generation solar only represented .5% (compared to 6.6% for hydropower 4.1% for wind and 1.5% for biomass).

    USA data based on only solar capacity that is connected to the grid (and my guess would be that is the measure used in other countries too). Data is largely from that Department of energy report, with historical data for other countries pulled from previous editions.

    The US Energy Information Agency (USEIA) expects the USA to add (net) 9,841 MW of wind capacity; 4,318 MW of natural gas capacity and 2,235 MW of solar in 2015. In 2015 they also predict a net decline of 12,922 MW of coal capacity. They also share that nuclear plants and natural gas combined-cycle generators having utilization factors 3 to 5 times those of wind and solar generators, which means capacity measures are significantly different from actually produced electricity measures.

    The USEIA has predicted “global solar PV capacity seen rising from 98 GW in 2012 to 308 GW in 2018.” They predicted in 2018 China would have the most solar PV capacity followed by Germany, Japan and the USA.

    The Solar Energy Industries Association (USA) states that 5,000 MW of solar capacity was added in the USA in 2013 and 7,000 MW in 2014. They forecast 8,000 MW to be added in 2015 and 12,000 MW in 2016.

    Related: Solar Direct Investing BondsChart of Global Wind Energy Capacity by Country 2005 to 2013Leasing or Purchasing a Solar Energy System For Your HouseNuclear Power Generation by Country from 1985-2010Google Invests $168 million in Largest Solar Tower Power Project (2011)Molten Salt Solar Reactor Approved by California (2010)15 Photovoltaics Solar Power Innovations (2008)

  • USA Health Care Spending 2013: $2.9 trillion $9,255 per person and 17.4% of GDP

    USA health care spending increased at a faster rate than inflation in 2013, yet again; increasing 3.5%. Total health expenditures reached $2.9 trillion, 17.4% of the nation’s Gross Domestic Product (GDP) or $9,255 per person.

    While this remains bad news the rate at which heath care is increasingly costing those in the USA has been slower the last 5 years than it has been in past years. Basically the system is getting worse at a slower rate than we used to be, so while that isn’t great, it beats getting worse as quickly as we used to be. For the last 5 years the rate of increase has been between 3.6% and 4.1%.

    GDP has increased more than inflation. As the GDP grows the economy has more production for society to split. The split between the extremely wealthy and the rest of society has become much more weighted to the extremely wealthy (they have taken most of the gains to the overall economy in the last 20 years). Health care has a similar track record of devouring the gains made by the economy. This has resulted in health care spending soaring over the decades in an absolute basis and as a percentage of GDP.

    The slow down in how badly the health care system has performed in the USA has resulted in the share of GDP taken by the health care system finally stabilizing. Health care spending has remained near 17.4% since 2009. While hardly great news, this is much better news than we have had in the last 30 years from the USA health care system. The percentage of GDP taken by the USA health care system is double what other rich countries spend with no better health results.

    It is similar to if a team started as a championship team and then got worse every year and now they have finally stopped getting even worse. Granted they have become the worst team in the league but if, say, their record has now been 5-55 for 3 years in a row, they at least are not winning fewer game in each subsequent year anymore. But you can hardly think you are doing a great job when you are clearly the worst team each and every year.

    Obviously there is a need for much much more improvement in the USA health care system. Still stopping the growth in spending, as a percent of GDP, is a positive step toward drastically decreasing it to reach a level more in live with all other rich countries. Even this goal is only to have the USA reach a level of mediocrity. If you actually believe the USA can to better than mediocre that would imply a combination of drastic declines in spending (close to 50%) and drastic gains in outcomes. Decreasing spending by 50% would put the USA at essentially the definition of mediocre – middling result with average spending.

    Health Spending by Type of Service or Product

    • Hospital Care: Hospital spending increased 4.3% to $936.9 billion in 2013 compared to 5.7% growth in 2012. The lower growth in 2013 was influenced by growth in both prices and non-price factors (which include the use and intensity of services).
    • Physician and Clinical Services: Spending on physician and clinical services increased 3.8% in 2013 to $586.7 billion, from 4.5% growth in 2012. Slower price growth in 2013 was the main cause of the slowdown, as prices grew less than 0.1%, due in part to the sequester and a zero-percent payment update.
    • (more…)

  • Historical Stock Returns

    One thing for investors consulting historical data to remember is we may have had fundamental changes in stock valuations over the decades (and I suspect they have). Just to over simplify the idea if lets say the market valued the average stock at a PE of 11 and everyone found stocks a wonderful investment. And so more and more people buy stocks and with everyone finding stocks wonderful they keep buying and after awhile the market is valuing the average stock at a PE of 14.

    Within the market there is tons of variation those things of course are not nearly that simple, but the idea I think holds. Well if you look back at historical data the returns will include the adjustment of going from a PE of 11 to a PE of 14. Now maybe the new few decades would adjust from PE of 14 to PE of 17 but maybe not. At some point that fundamental re-adjustment will stop.

    And therefore future returns would be expected to be lower than historically due to this one factor. Now maybe other factors will increase returns to compensate but if not the historical returns may well provide an overly optimistic view.

    And if there is a short term bubble that lets say pushes the PR to 16 while the “fair” long term value is 14, then there will be a negative impact on the returns going forward bringing the PE from 16 to 14. That isn’t necessarily a drop (though it could be) in stock prices, it could just be very slow increases as earning growth slowly pushes PE back to 14.

    Monument to the People's Heroes with the Shanghai skyline in the background
    Monument to the People’s Heroes with the Shanghai skyline in the background. See more photos by John Hunter

    Another thing to consider is another long term macro-economic factor may also be giving long term historical returns an extra boost. The type of economic growth from the end of World War I to 1973 (just to pick a specific time, there was a big economic slowdown after OPEC drastically increased the price of oil). While that period includes the great depression and World War II, which massively distorts figures, from the end of WW I through the 1960s Europe and the USA went through an amazing amount of economic growth.

    (more…)

  • Wealthiest 1% Continue Dramatic Gains Compared to Everyone Else

    This richest 1% continue to take advantage of economic conditions to amass more and more wealth at an astonishing rate. These conditions are perpetuated significantly by corrupt politicians that have been paid lots of cash by the rich to carry out their wishes.

    One thing people in rich countries forget is how many of them are in the 1% globally. The 1% isn’t just Bill Gates and Warren Buffett. 1% of the world’s population is about 72 million people (about 47 million adults). Owning $1 million in assets puts you in the top .7% of wealthy adults (Global Wealth Report 2013’ by Credit Suisse). That report has a cutoff of US $798,000 to make the global 1%. They sensibly only count adults in the population so wealth of $798,000 puts you in the top 1% for all adults.

    $100,000 puts you in the top 9% of wealthiest people on earth. Even $10,000 in net wealth puts you in the top 30% of wealthiest people. So while you think about how unfair it is that the system is rigged to support the top .01% of wealthy people also remember it is rigged to support more than 50% of the people reading this blog (the global 1%).

    I do agree we should move away from electing corrupt politicians (which is the vast majority of them in DC today) and allowing them to continue perverting the economic system to favor those giving them lots of cash. Those perversions go far beyond the most obnoxious favoring of too-big-to-fail banking executives and in many ways extend to policies the USA forces on vassal states (UK, Canada, Australia, France, Germany, Japan…) (such as those favoring the copyright cartel, etc.).

    Those actions to favor the very richest by the USA government (including significantly in the foreign policy – largely economic policy – those large donor demand for their cash) benefit the global 1% that are located in the USA. This corruption sadly overlays some very good economic foundations in the USA that allowed it to build on the advantages after World War II and become the economic power it is. The corrupt political system aids the richest but also damages the USA economy. Likely it damages other economies more and so even this ends up benefiting the 38% of the global .7% that live in the USA. But we would be better off if the corrupt political practices could be reduced and the economy could power economic gains to the entire economy not siphon off so many of those benefits to those coopting the political process.

    The USA is home to 38% of top .7% globally (over $1,000,000 in net assets).

    country % of top .7% richest % of global population
    USA 38.3% 4.5%
    Japan 8.6% 1.8%
    France 7.5% .9%
    UK 6.1% .9%
    Germany 5.9% 1.1%
    other interesting countries
    China 3.4% 19.2%
    Korea 1% .7%
    Brazil .6% 2.8%
    India .5% 17.5
    Indonesia .3% 3.5%

    Oxfam published a report on these problems that has some very good information: Political capture and economic inequality

    (more…)

  • 20 Most Popular Posts on Our Blog in 2014

    Most popular posts on the Curious Cat Investing and Economics blog in 2014 (by page views).

    Related: 20 Most Popular Post on Curious Cat Science and Engineering Blog in 201410 Most Popular Posts on the Curious Cat Management Blog in 2014Most Popular Posts on the Curious Cat Management Comments Blog

  • There is No Such Thing as “True Unemployment Rate”

    The article, What’s the Real U.S. Unemployment Rate? We Have No Idea, provides interesting information on the process for calculating the unemployment rate.

    But it also misleads in saying “real US unemployment rate.”

    As Dr. Deming said: “there is no true value” of any measured process. The results depend on the process which includes the operation definitions used.

    Over time the value of a measure (as a proxy measure for some condition you care to monitor) can change.

    It is important to update measures to avoid using proxies that lose value.

    The unemployment rate certainly has proxy issues. But there is no “true unemployment rate.” There are ways to change the process to focus on different things (make the proxy better matched to certain issues). But also it seems to me, unemployment rate needs to have other related measures that are considered in concert with the unemployment rate (such as the labor force participation rate, perhaps some measure of under-employment etc.).

    Those paying much attention do use other measures in concert but the last few years I read lots of different people complaining that the unemployment rate doesn’t capture various aspects of how the job market is poor (and often claiming the unemployment rate was “inaccurate” as though there was a platonic form of the actual rate divorced from the measure process.

    Related: What Do Unemployment Stats Mean?Economic Measurement Issues Arising from GlobalizationWhy China’s Economic Data is Questionable

  • Chart of Global Wind Energy Capacity by Country 2005 to 2013

    chart of Wind power capacity by country 2005 to 2013
    Chart by Curious Cat Economics Blog using data from the Wind Energy Association. Chart may be used with attribution as specified here.

    In 2013 the addition to wind power capacity slowed a great deal in most countries. Globally capacity was increased just 13% (the increases in order since 2006: 26%, 27%, 29%, 32%, 25%, 19% and again 19% in 2012). China alone was responsible for adding 16,000 megawatts of the 25,838 total added globally in 2013.

    At the end of 2013 China had 29% of global capacity (after being responsible for adding 62% of all the capacity added in 2013). In 2005 China had 2% of global wind energy capacity.

    The 8 countries shown on the chart account for 81% of total wind energy capacity globally. From 2005 to 2013 those 8 countries have accounted for between 79 and 82% of total capacity – which is amazingly consistent.

    Wind power now accounts for approximately 4% of total electricity used.

    Related: Chart of Global Wind Energy Capacity by Country 2005 to 2012In 2010 Global Wind Energy Capacity Exceeded 2.5% of Global Electricity NeedsGlobal Trends in Renewable Energy InvestmentNuclear Power Generation by Country from 1985-2010

    (more…)

  • Chart of Net Government Debt from 1980 to 2013 by Country

    chart of Government debt from 1980 to 2013

    The data, from IMF, does not include China or India.

    The chart shows data for net debt (gross debt reduced by certain assets: gold, currency deposits, debt securities etc.).

    Bloomberg converted [broken link was removed] the data to look at debt load per person (looking at gross debt – estimated for 2014). Japan has ill-fortune to lead in this statistic with $99,725 in debt per person (242% of GDP), Ireland is in second with $60, 356 (121% of GDP). USA 3rd $58,604 (107%). Singapore 4th $56,980 (106%). Italy 6th $46,757 (133%). UK 9th $38,939 (95%). Greece 12th $38,444 (174%). Germany 14th $35,881 (78%). Malaysia 32nd $6,106 (57%). China 48th $1,489 (21%). India 53rd $946 (68%). Indonesia 54th $919 (27%).

    I think the gross debt numbers can be more misleading than net debt figures. I believe Singapore has very large assets so that the “net” debt is very small (or non-existent). Japan is 242% in gross debt to GDP but 142% of net debt (which is still huge but obviously much lower). The USA in contrast has gross debt at 107% with a net debt of 88%.

    Related: Government Debt as Percent of GDP 1998-2010 for OECDGross Government Debt as Percentage of GDP 1990-2009: USA, Japan, Germany, ChinaChart of Largest Petroleum Consuming Countries from 1980 to 2010Top Countries For Renewable Energy Capacity

  • USA Health Expenditures Reached $2.8 trillion in 2012: $8,915 per person and 17.2% of GDP

    USA health care spending increased at a faster rate than inflation in 2012, yet again; increasing 3.7%. Total health expenditures reached $2.8 trillion, which translates to $8,915 per person or 17.2% of the nation’s Gross Domestic Product (GDP).

    The GDP is calculated was adjusted in 2013 and the data series going back in time was adjusted. These changes resulted in increasing historical GDP values and making the portion of GDP for health care to decline (for example in 2011 using the old calculation health care was 17.9% of GDP and now 2011 is shown as health care spending representing 17.3% of GDP).

    While health care spending increased faster than inflation yet again, the economy actually grew at a higher rate than health care spending grew. That the spending on health care actually declined as a percentage of GDP is good news; and it may even be that this hasn’t happened for decades (I am not sure but I think that might be the case).

    Still health care spending growing above the rate of inflation is bad news and something that has to change. We have to start addressing the massive excessive costs for health care in the USA versus the rest of the world. The broken USA health care system costs twice as much as other rich countries for worse results. And those are just the direct accounting costs – not the costs of millions without preventative health care, sleepness nights worrying about caring for sick children without health coverage, millions of hours spent on completing forms to try and comply with the requirements of the health care system’s endless demand for paperwork, lives crippled by health care bankruptcies…

    Health Spending by Type of Service or Product: Personal Health Care

    • Hospital Care: Hospital spending increased 4.9% to $882 billion in 2012.
    • Physician and Clinical Services: Spending on physician and clinical services increased 4.6% in 2012 to $565 billion.
    • Other Professional Services: Spending for other professional services reached $76 billion in 2012, increasing 4.5%. Spending in this category includes establishments of independent health practitioners (except physicians and dentists) that primarily provide services such as physical therapy, optometry, podiatry, and chiropractic medicine.
    • (more…)